Bitcoin Broke up the New Resistance Today
Bitcoin price was trying to break up one of great resistance at 95800 USD. It is broken up today. Bitcoin tried to break up this resistance for a week. I was waiting for price reversing down on Bitcoin price chart due to this resistance. But I was wrong about this. Bitcoin broke up the new resistance..
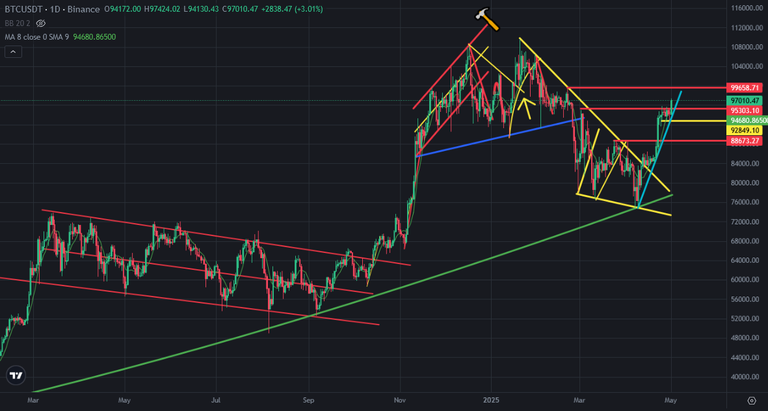
Here you can see daily chart of Bitcoin and the resistances. After breaking up the resistance at 95800 USD, 99600 USD is the new resistance for Bitcoin price chart. Even Bitcoin broke up the resistance today, I can not go up fast. There may be something.
There is also uptrend line on Bitcoin price chart. It is following the price. If we see a big daily red candle, we may see how it support Bitcoin price chart.
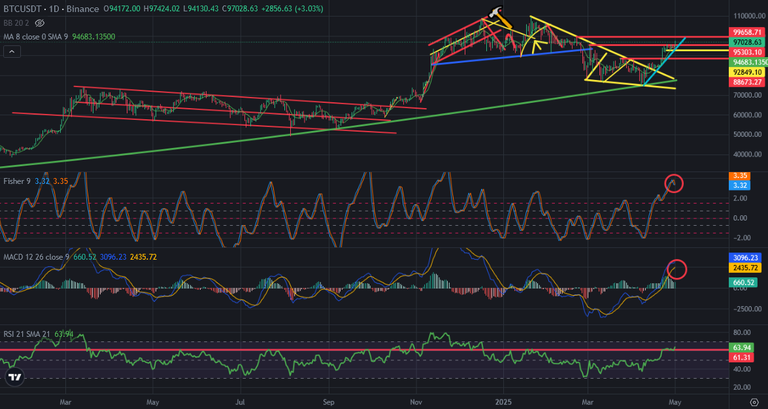
Here you can see the indicators on daily chart of Bitcoin. Fisher Indicator reversed down a few days ago. After breaking up the resistance, it reversed up from the top and trying to go up.
MACD Indicator is close to reverse down. Bitcoin price should go up for not to reverse down on MACD Indicator.
There was great resistance on RSI Indicator. It is broken up now. We should see daily close above this resistance.
We should see the hype after breaking up great resistances. Even Bitcoin price broke up one of great resistance of 2025, there is no hype. Price is going up slowly. We should see daily closes.
We will see..
Posted Using INLEO
"Interesting analysis! Do you think Bitcoin can maintain momentum above 99600 USD, or is another pullback likely?"
140K-180K top will be in by Christmas for this cycle. Alt coins will continue to lag as the scene has changed.