07-08-2025-Mechanical Measurements - Signal Analysis [EN]-[IT]
~~~ La versione in italiano inizia subito dopo la versione in inglese ~~~
ENGLISH

07-08-2025-Mechanical Measurements - Signal Analysis [EN]-[IT]
With this post, I would like to provide a brief overview of the topic mentioned above.
(code notes: X-94)
Signal Analysis
Image created with artificial intelligence, the software used is Microsoft Copilot
Introduction
Regarding signal analysis in the time domain, we can say the following. The time domain signal is statistically analyzed for both amplitude and frequency. The main parameters can be: mean value, root mean square, and effective value.
Additional indicators can be the maximum value, the minimum value, the crest factor, or the shape factor.
Below is an example of a classic graph of a time-domain signal, where the X-axis represents time in seconds and the Y-axis represents the amplitude of a 5 Hz sinusoidal signal.
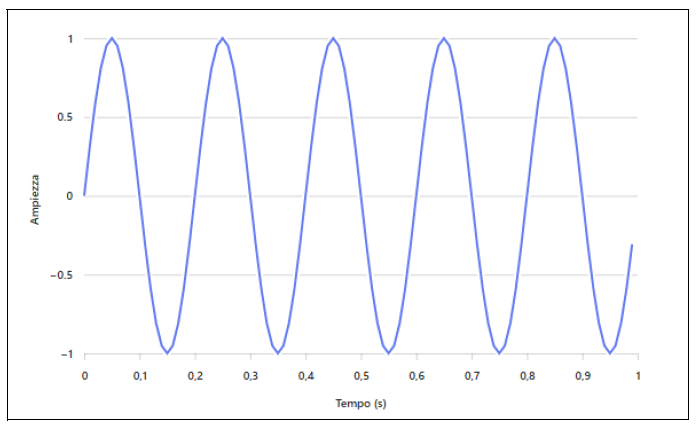
Image created with artificial intelligence, the software used is Microsoft Copilot
Exercise on time descriptors
Let's consider the following Signal
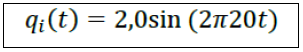
Below is the graph of the signal described above.
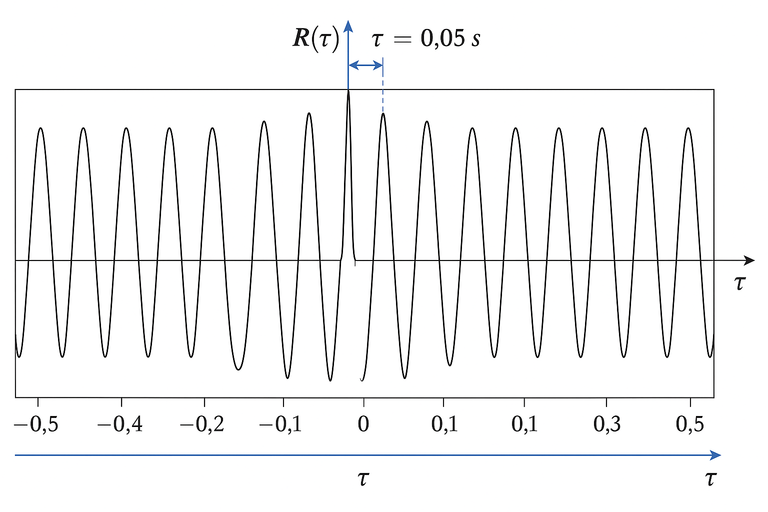
Image created with artificial intelligence, the software used is ChatGPT
Let's try to calculate the temporal descriptors (mean value, mean absolute value, rms value, (peak, crest factor, and form factor)
Average Value
The average value is the arithmetic mean of the signal values over time. The graph shows a symmetrical sinusoidal signal. In this case, the average value is = 0
Absolute Average Value
The absolute average value is the average of the absolute values of the signal. In this case, the sign is ignored and we have a value that indicates how much the signal deviates from zero.
The absolute average value of the operating signal is 1.272
Root Mean Square (RMS)
The RMS value stands for Root Mean Square. This value is the square root of the average of the squares of the signal values. It is also called the RMS value because it is useful for estimating energy.
The RMS value of the operating signal is 1.414
Peak Value
The peak value is simply the maximum value reached by the signal.
The peak value of the exercise signal is 2.0
Crest Factor
The crest factor is the ratio of the peak value to the effective mean value (RMS). Essentially, the crest factor indicates how impulsive the signal is; that is, the higher this factor, the more pronounced the signal's peaks.
The crest factor of the exercise signal is 1.415
Shape Factor
The shape factor is the ratio of the RMS value to the absolute mean value. This ratio is calculated to provide a mathematical value that describes the signal's shape.
The shape factor of the exercise signal is 1.111
Autocorrelation Exercise
Autocorrelation Function R(τ)
Autocorrelation measures the signal's similarity to itself shifted in time by τ. This function is useful for detecting periodicity, estimating the dominant frequency, and analyzing noisy signals.
Let's always consider the graph proposed above.
In this case, the graph shows a sinusoidal function with a frequency of 20 Hz, and therefore a period of 0.05 s.
This corresponds to the signal period qi (t) (since f = 20 Hz ⇒ T = 1/f = 0.05 s)
The graph is shown below.
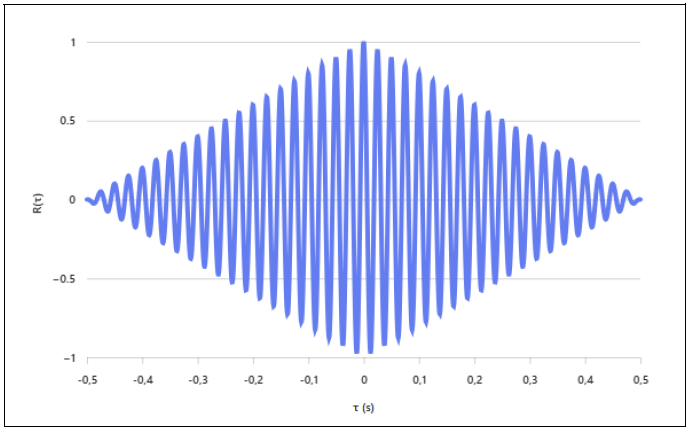
Image created with artificial intelligence, the software used is Microsoft Copilot
Conclusions
In the context of time-domain signal analysis, we can say that temporal descriptors allow us to quantify the characteristics of a signal over time, while the autocorrelation function R(τ) measures how similar the signal is to itself when shifted in time by a certain interval τ.
Question
Time-domain signal analysis has a long history. However, we can say that one scientist who brought a breakthrough to these studies was Jean-Baptiste Joseph Fourier. Many are familiar with Fourier and his work in the frequency domain, including his famous Fourier transform, but did you know that his work also brought a major breakthrough to time-domain signal analysis?
![]()
ITALIAN

07-08-2025-Misure meccaniche - Analisi di un segnale [EN]-[IT]
Con questo post vorrei dare una breve istruzione a riguardo dell’argomento citato in oggetto
(code notes: X-94)
Analisi di un segnale
immagine creata con l’intelligenza artificiale, il software usato è Microsoft Copilot
Premessa
Per quanto riguarda l’analisi del segnale nel dominio del tempo possiamo dire quanto segue. Il segnale nel dominio del tempo viene analizzato in termini statistici sia per l’ampiezza che per la frequenza. I parametri principali possono essere: valore medio, valore quadratico medio e valore efficace.
Gli indicatori aggiuntivi possono essere il valore massimo, il valore minimo, il fattore di cresta o il fattore di forma.
Qui di seguito un esempio di un grafico classico di un segnale nel dominio del tempo dove sull’asse X è rappresentato il tempo in secondi e sull’asse Y è rappresentata l’ampiezza di un segnale sinusoidale a 5 Hz
immagine creata con l’intelligenza artificiale, il software usato è Microsoft Copilot
Esercizio sui descrittori temporali
Prendiamo in considerazione il seguente segnale
Qui di seguito il grafico del segnale sopra descritto
immagine creata con l’intelligenza artificiale, il software usato è ChatGPT
Proviamo a calcolare i descrittori temporali (valore medio, valore medio assoluto, valore efficace, valore di picco, fattore di cresta e fattore di forma)
Valore medio
Il valore medio è la media aritmetica dei valori del segnale nel tempo. Il grafico mostra un segnale sinusoidale simmetrico. In questo caso il valore medio è = 0
Valore medio assoluto
Il valore medio assoluto è la media dei valori assoluti del segnale. In questo caso il segno viene ignorato ed abbiamo un valore che ci indica quanto il segnale si discosta da zero.
Il valore medio assoluto del segnale dell’esercizio è 1,272
Valore efficace (RMS)
La signa RMS è l’acronimo di Root Mean Square. Questo valore è la radice quadrata della media dei quadrati dei valori del segnale. Viene chiamato anche valore efficace in quanto è utile per stimare l’energia.
Il valore efficace del segnale dell’esercizio è 1,414
Valore di picco
Il valore di picco è semplicemente il valore massimo raggiunto dal segnale.
Il valore di picco del segnale dell’esercizio è 2,0
Fattore di cresta
Il fattore di cresta è il rapporto tra il valore di picco e il valore efficace (RMS). Sostanzialmente il fattore di cresta indica quanto il segnale sia impulsivo, cioè più questo fattore è alto e più il segnale ha picchi molto evidenti.
Il fattore di cresta del segnale dell’esercizio è 1,415
Fattore di forma
Il fattore di forma è il rapporto tra il valore RMS e il valore medio assoluto. Questo rapporto viene calcolato per poter dare un valore matematico che descriva la forma del segnale.
Il fattore di forma del segnale dell’esercizio è 1,111
Esercizio sull'autocorrelazione
Funzione di autocorrelazione R(τ)
L’autocorrelazione misura la somiglianza del segnale con se stesso spostato nel tempo di τ. Questa funzione è utile per rilevare la periodicità, stimare la frequenza dominante e analizzare segnali rumorosi.
Prendiamo sempre in considerazione il grafico proposto prima.
In questo caso il grafico mostra una funzione sinusoidale con frequenza di 20Hz, quindi un periodo di 0,05 s.
Questo corrisponde al periodo di segnale qi (t) (dato che f=20 Hz⇒T=1/f=0.05 s)
Qui di seguito è mostrato il grafico
immagine creata con l’intelligenza artificiale, il software usato è Microsoft Copilot
Conclusioni
Nell'ambito dell’analisi dei segnali nel dominio del tempo possiamo dire che i descrittori temporali ci permettono di quantificare le caratteristiche di un segnale nel tempo, mentre la funzione di autocorrelazione R(τ) misura quanto il segnale è simile a se stesso quando viene traslato nel tempo di un certo intervallo τ.
Domanda
L'analisi dei segnali nel dominio del tempo ha una lunga storia. Possiamo però dire che uno scienziato a dare una svolta a questi studi è stato Jean-Baptiste Joseph Fourier. Molti conoscono Fourier ed il suo lavoro nel dominio della frequenza compresa la sua famosa trasformata di Fourier, ma lo sapevate che il suo lavoro ha creato una svolta importante anche per l'analisi dei segnali nel dominio del tempo?
THE END
@tipu curate
Upvoted 👌 (Mana: 27/47) Liquid rewards.
Grazie Claudio per il tipu. Ho iniziato questa serie di post educativi e non riesco piu a smettere. La mia intenzione era quella di inserire in HIVE un po’ di post dedicati all’istruzione tecnica, ma adesso è diventato per me anche un piacevole ripasso. Inoltre noto che con qualche commento, lasciato proprio su questi post, si imparano ulteriori cose. !HBIT
stefano.massari, you mined 0.9 🟧 HBIT and the user you replied to (claudio83) received 0.1 HBIT on your behalf as a tip. You can receive 100% of the HBIT by replying to one of your own posts or comments. When you mine HBIT, you're also playing the Wusang: Isle of Blaq game. 🏴☠️ | tools | wallet | discord | community | daily <><
What's more, you found 1.0 ⚪ BLAQ pearl as a bonus treasure token!

Your random number was 0.2144900458626463, also viewable in the Discord server, #hbit-wusang-log channel. Check for bonus treasure tokens by entering your username at block explorer A, explorer B, or take a look at your wallet.
There is a treasure chest of bitcoin sats hidden in Wusang: Isle of Blaq. Happy treasure hunting! 😃 Read about Hivebits (HBIT) or read the story of Wusang: Isle of Blaq.
I descrittori temporali sono tantissimi da ricordare e non banali, tipo la radice quadrata della media dei quadrati sembra uno sciogli lingua 😂
L'autocorrelazione mi ha sbloccato un ricordo
!PIZZA
ciao Davide, i descrittori temporali hanno un nome da giustizieri della notte! Sono parametri che descrivono l’andamento di un segnale nel tempo e servono per caratterizzare fenomeni che variano, più o meno rapidamente, durante la misura. Quello che hai citato tu inizia ad essere complicato anche solo evocarlo. Io mi fermo al valore medio, al valore efficace, al fattore di cresta e fattore di forma… agli altri ci penseremo. hahaha. !CTP
$PIZZA slices delivered:
@davideownzall(6/15) tipped @stefano.massari
Come get MOONed!
This is really the first time I will be hearing about the signal analysis and I am grateful that you explained this to me in a well detailed format for me to easily understand
Thanks, julie100. I always try to explain things simply, but I don't always succeed. Thank you for your kind words. Signal analysis is a type of analysis that is very important for understanding how signals can change over time. In this post, I discuss some temporal descriptors, which are also useful for analyzing a cryptocurrency chart. !DIY
https://x.com/jewellery_all/status/1953524546138456289
https://x.com/lee19389/status/1953581782533841308
#hive #posh
Un argomento di cui non ho molta conoscenza
Ciao Lu, parlare dello studio dei segnali nelle misure meccaniche significa entrare nel cuore della diagnostica e dell’analisi delle macchine reali. Poi a volte, sapere analizzare i grafici può anche aiutare a comprendere alcune cose che vanno oltre ad un segnale, ad esempio la comprensione dei segnali puoi aiutare a comprendere meglio il grafico dell'andamento di un asset finanziario.
@stefano.massari, I paid out 0.175 HIVE and 0.038 HBD to reward 6 comments in this discussion thread.