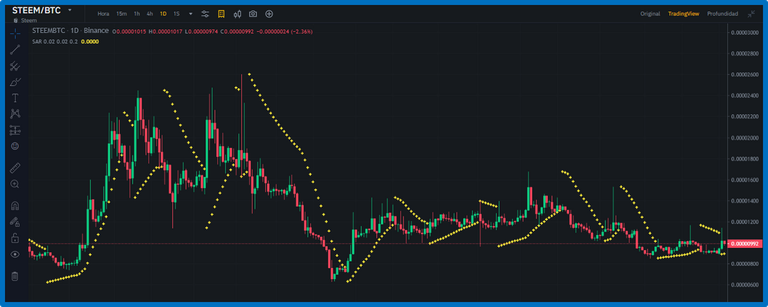
Technical functionality of the Parabolic Sar indicator
In the cryptocurrency market, determining when an uptrend, or downtrend, has ended is one of the situations that most concerns people who trade by buying/selling.
Now, there are technical tools that serve to give us an orientation of the direction and trend changes, among these one of those that I have been particularly testing is the Parabolic Sar indicator, since it is one of those technical tools that can be used to deduce the probable behavior of the trend.
I would like to emphasize that, based on the bibliographic references consulted, it is important to consider some important elements of the Parabolic Sar indicator, which reflects a set of price data with statistical projection, which allow us us to know the market trend.

On the other hand, the PSAR allows to determine when a trend will end, or when it is closer to ending, and at a graphic level the Parabolic Sar indicator is a series of points that appear above or below the price, which serve as a guide to make entry or exit decisions at a certain time and market action.
Congratulations @jumabee! You have completed the following achievement on the Hive blockchain And have been rewarded with New badge(s)
Your next target is to reach 50 upvotes.
You can view your badges on your board and compare yourself to others in the Ranking
If you no longer want to receive notifications, reply to this comment with the word
STOPCheck out our last posts: