SPS Price is Trying To Break up Great Resistance
SPS price stuck between great downtrend line and uptrend line. I shared a few analysis about SPS price and said we will see great breaking up or down on SPS price chart. SPS price tried to break up this great downtrend line. We could not see daily close above this great resistance.
Here you can see daily chart of SPS price. There is great support line increasing slowly. It supported SPS price 4 times. It may be hard to see breaking down this great support line. There is great downtrend line coming from May 2025. It is tested 3 times to break up. Even SPS price tried to break up this downtrend line last week, we have not seen daily close above this downtrend line.
These up and downtrend lines will cross each other until the end of this month.

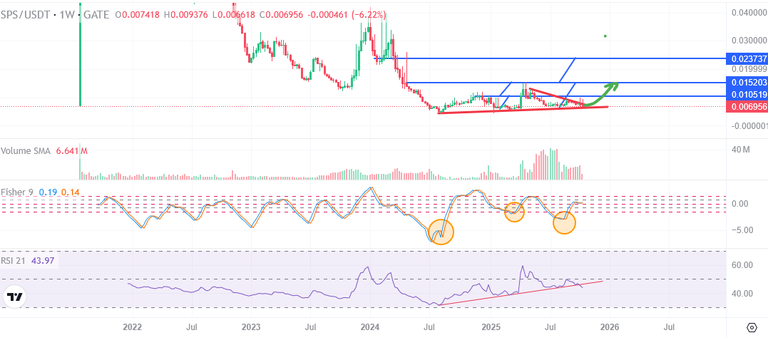
Here you can see the indicators on weekly chart of SPS price. There was great uptrend line on RSI Indicator. It is broken down. This is one of major bearish scenario for SPS price. Fisher Indicator is also trying to reverse down from the middle level. SPS price should get weekly green candles.
Here you can see SPS/Hive pair chart. There was handle cup pattern on this pair chart. After I shared this handle cup pattern, SPS broke up this handle cup pattern. You can see what happened after breaking up this great resistance on this pattern.
We may see retest on great resistance as a support.

So, we may see huge moves on SPS price chart after end of this month. It may be great level and time to pick up discounted SPS from this level.
We will see..
Posted Using INLEO