Pull Back is on SPS Price Chart
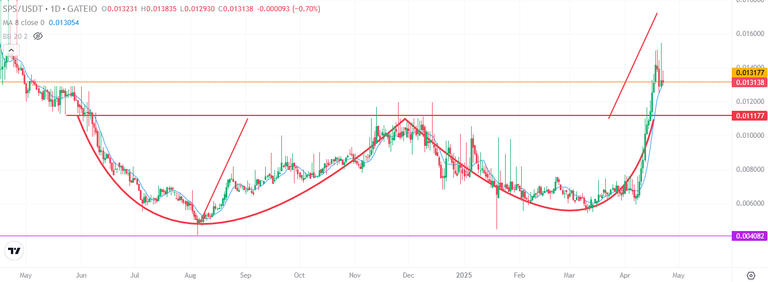
SPS (Splintershards) is one of the best performer on crypto market in April. It is up more than 100%. It went uo without price correction. Price correction appeared on SPS price chart finally. It is good to see healthy pump for long term.
Here you can see daily chart of SPS. SPS price is down 10% from the top. Even it is down, it is still above 8-day moving average which is signal of midterm. If SPS completes price correction above this moving average, we will see another price pump on SPS price chart.
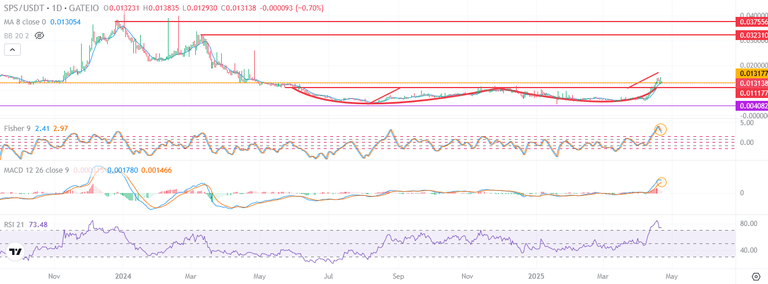
Here you can see the indicators on daily chart of SPS. Fisher Indicator reversed down from the top. MACD Indicator close to reverse down from the top. If we see green candles on daily chart of SPS, we will see reversing up on Fisher Indicator and SPS price may go up until the first price target of handle cup pattern.
RSI Indicator is at still overbought level. It needs to complete correction. When we look at the indicators we may see 2nd price pump on SPS price chart.
Tokenomics and the price of crypto of the playtoearn games are so important for hype. SPS is gaining hype thanks to price pump of SPS. Much value of SPS price is equal to much income from playtoearn games.
Thanks to SPS price pump, earnings is increasing..
We will see..
Posted Using INLEO
This post has been manually curated by @bhattg from Indiaunited community. Join us on our Discord Server.
Do you know that you can earn a passive income by delegating your Leo power to @india-leo account? We share 100 % of the curation rewards with the delegators.
100% of the rewards from this comment goes to the curator for their manual curation efforts. Please encourage the curator @bhattg by upvoting this comment and support the community by voting the posts made by @indiaunited.