Hive Price Can not Break up the Top Line of Depression Zone
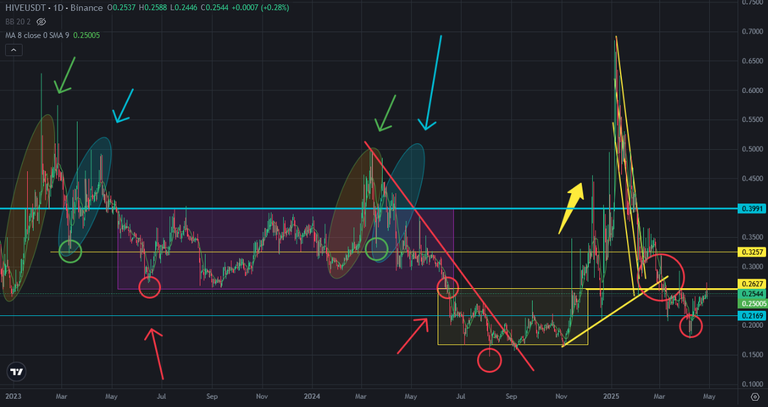
Hive price is under the top line of depression zone. This why Hive price can not do up fast. Hive price made a correction after touching 0,70 USD. It went down 80% and entered depression zone which I shared it last year.
Here you can see daily chart of Hive and my draft. I drew this drew a few years ago and It worked as well. 0,26 USD is great resistance for Hive price and you can see how it resisted Hive price. It is tested two times to break up after correction. It will be hard to break up. Because it is important level. It is start point of bullish trend. You can see what happened after breaking up this resistance. If Hive price breaks up this resistance, we will see bullish moves on Hive price chart.
Here you can the indicators on daily Hive price chart. Fisher Indicators was on the top and it reversed down. There is uptrend line on MACD Indicator. It supported MACD Indicator two times. After reversing down on Fisher Indicator MACD Indicator may break down the support line.
There is also bowl patten on RSI Indicator. It started to appear. I will fosuc this bowl pattern in ext days. It is important pattern will support Hive price.
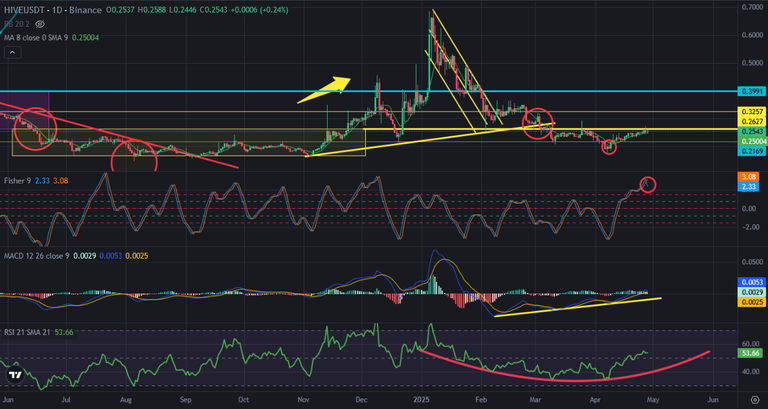
So, we may see a little price dump on Hive price chart. It may go down the the middle line of depression zone. RSI Indicator may touch the bowl pattern as a support.
As I said, I will focus on bowl pattern on RSI Indicator that can show us the future.
We will see..
Posted Using INLEO
Indeed Hive like most Alts are not participating in the bull market this cycle. Bitcoin will top around 140K-190K by Christmas give or take a month or two. I’d bet 99% of cryptos do not touch 2021 highs.