Curve Resistance is on Hive Price Chart
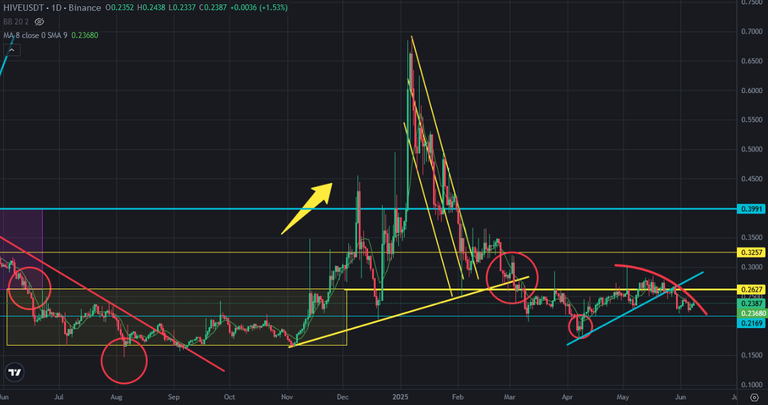
There is curve resistance on Hive price chart. Hive price will break up this resistance in a few days. It is tested 4 times before and It can not be broken down. I shared lots of analysis about Hive price chart and I drew my draft a few years ago. It worked as well. When we look at Hive price chart today, Hive price seems to stuck between the middle line of depression zone and curve resistance.
Here you can see daily chart of Hive. We are close to break up or down of curve or the middle line of depression zone. When we look at market conditions, we can say that Hive price will break up curve resistance.
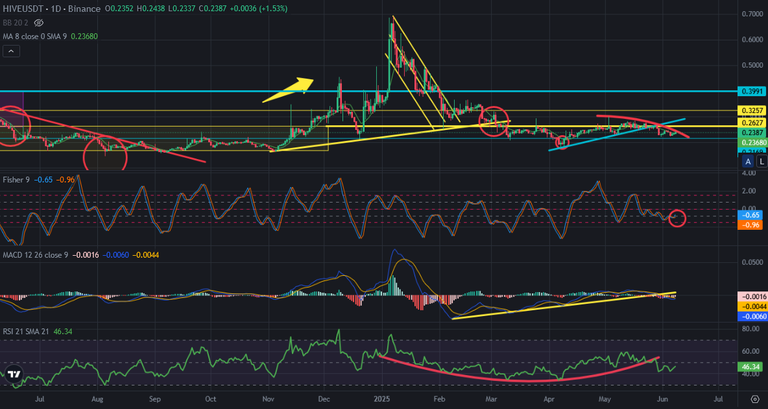
Here you can see the indicators on daily chart of Hive. Fisher Indicator is on the bottom and This is why I say that we are close to see breaking up curve resistance on Hive price chart.
Even bowl pattern on RSI Indicator is broken down, Even mini uptrend line of MACD Indicator is broken down, I believe that Hive price may break up the curve resistance.
The top level of depression zone is always major resistance for Hive price chart. We will focus if Hive price can break up this resistance after curve resistance.
We will see..
Posted Using INLEO
Congratulations @chorock! You have completed the following achievement on the Hive blockchain And have been rewarded with New badge(s)
You can view your badges on your board and compare yourself to others in the Ranking
If you no longer want to receive notifications, reply to this comment with the word
STOPCheck out our last posts: