Bitcoin Price Tested Again to Break Up Downtrend Line
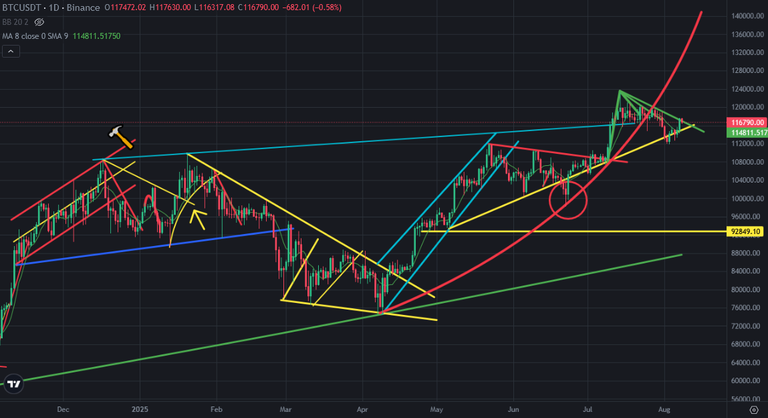
There was downtrend line on Bitcoin price chart coming from all time high. Bitcoin tested 3 times to break up this downtrend line. This is 4th time for trying to break up this downtrend line. When we see breaking up on this downtrend line, Bitcoin price may enter mega bullish season.
Here you can see daily chart of Bitcoin price. Bitcoin price was going up slowly by supporting uptrend line. Bitcoin ğrice got big green candle yesterday and met with this downtrend line. We should see breaking up of this downtrend line to be certain that we are in mega bullish season.
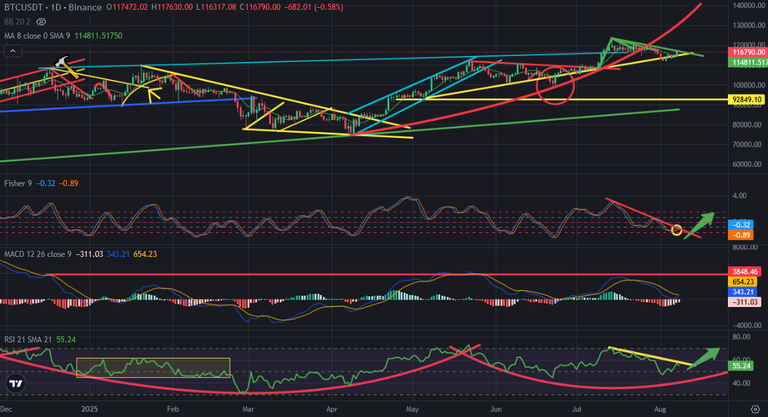
Here you can see the indicators on daily chart of Bitcoin price. There is also great downtrend line on RSI Indicator. We should see breaking up on this indicator. There was mini downtrend line on Fisher Indicator. It is so possible to see breaking up in Fisher Indicator. RSI Indicator is more important than Fisher Indicator. We should see breaking up on both of them.
MACD Indicator is also trying to reverse up. When we see breaking up on these indicator, MACD Indicator will reverse up. These are bullish scenarios. If not, we will see reversing down from great downtrend line coming from all time high.
We are at decision days for Bitcoin. We will enter mega bullish season or we will enter price correction again.
We will see what will happen..
Posted Using INLEO
This post has been manually curated by @bhattg from Indiaunited community. Join us on our Discord Server.
Do you know that you can earn a passive income by delegating your Leo power to @india-leo account? We share 100 % of the curation rewards with the delegators.
100% of the rewards from this comment goes to the curator for their manual curation efforts. Please encourage the curator @bhattg by upvoting this comment and support the community by voting the posts made by @indiaunited.