Bitcoin Price Supported by 100-Week Moving Average
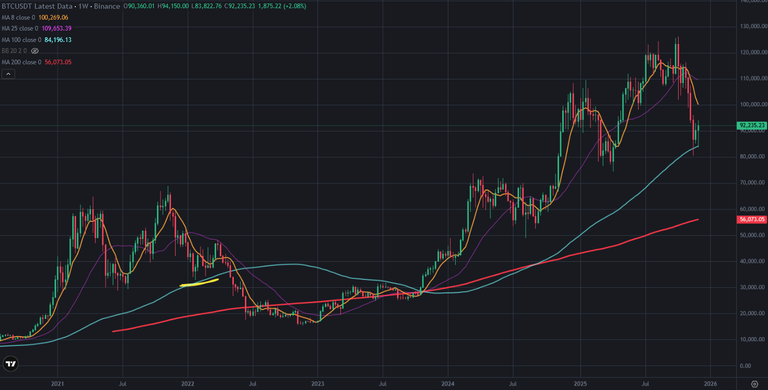
While Bitcoin price is going down from all time high, It broke lots of moving averages that supported Bitcoin price. There was the great one. 100-week moving average supported Bitcoin price while Bitcoin price going down. Even we have seen the candle below this moving average, Bitcoin price closed the week above this moving average.
Here you can see weekly chart of Bitcoin price. I draw the similarity between 2022 and now. We did see same scenario in 2022. After supported by this moving average, Bitcoin price tried to break down again and It did. You can see what happened after breaking down this average. Bitcoin price went down more than 50%.
Here you can see the indicators on weekly chart of Bitcoin price. There was also great support line on RSI Indicator and It is broken down. We should see the new bullish pattern on Bitcoin price chart to make bullish analysis.
Fisher and MACD Indicator are also close to the bottom and they may reverse up in a few weeks. If we see this reversing up, we may see mini bullish trend on crypto market.
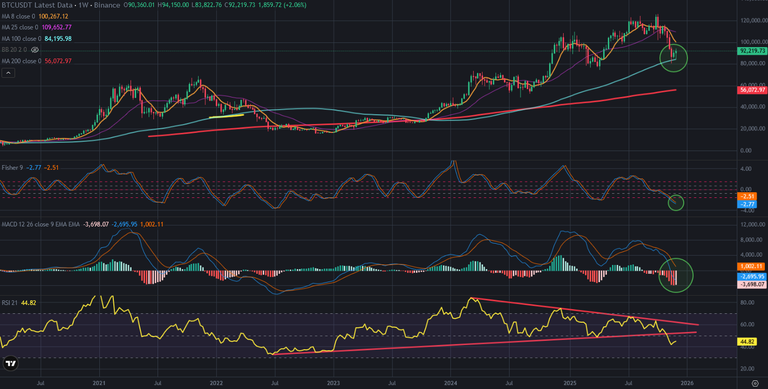
So, it is so possible to see dead cat bounce in next weeks. If Bitcoin price breaks down 100-week moving average, we can see ''good bye'' to crypto market.
We will see..
Posted Using INLEO
Decentralized and secure transactions 🔒Potential for high returns on investment 🚀Global accessibility and borderless transactions 🌐Limited supply can help prevent inflation 📈Fast and low-cost transactions compared to traditional banking 💸