Bitcoin Price Stuck in Bollinger Bands Before High Volatility
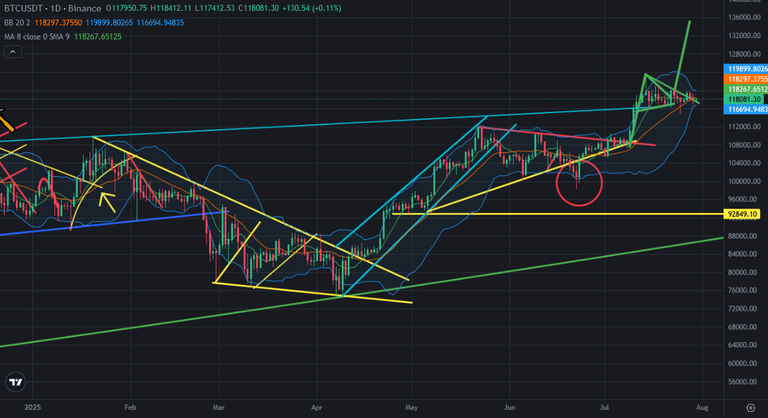
Bolliger Bands narrowed on daily chart of Bitcoin price. It is the signal of high volatility. We can see high volatility after this narrowed Bollinger Bands. There is the result of interest rate of FED, It is so possible to see high volatility on crypto market.
Here you can see daily chart of Bitcoin. Even Bitcoin price broke up mini downtrend lines, It can not go up with high volatility. Bitcoin price is under the middle line of Bollinger Bands. It is supported by the bottom line of Bollinger Bands. We will see the decision on Bitcoin price to go up or go down.
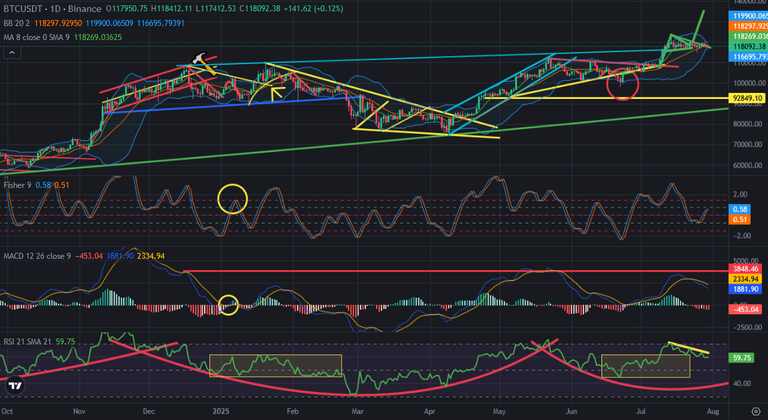
Here you can see the indicators on daily chart of Bitcoin price. Fisher Indicator is going up slowly. If we see huge daily green daily it will get accelaration while going up. It is good level to increase accelaration.
But MACD Indicator is still in correction. If we see daily red candle, Fisher Indicator will try to reverse down. When we look at the indicators, we can see the position of decision.
There is also downtrend line on RSI Indicator which resist Bitcoin price. It should be broken up to enter new bullish trend.
So, it is the decision day of Bitcoin to go up or down. We may see high volatility on crypto market in this week.
We will see..
Posted Using INLEO
This post has been manually curated by @bhattg from Indiaunited community. Join us on our Discord Server.
Do you know that you can earn a passive income by delegating your Leo power to @india-leo account? We share 100 % of the curation rewards with the delegators.
100% of the rewards from this comment goes to the curator for their manual curation efforts. Please encourage the curator @bhattg by upvoting this comment and support the community by voting the posts made by @indiaunited.
Short... Long 🚀