Bitcoin Price Reversed Down to Go Under 200-Day Moving Average
200-day moving average is the greatest support level for Bitcoin price chart. While market crash at 10th October, Bitcoin price broke down this great support level. Bitcoin price tried to reverse up to reach all time high but there is no hype and cash flow into crypto market. So, it was only dead cat bounce.
Here you can see daily chart of Bitcoin price. Bitcoin price reversed down and It will break down again 200-day moving average. I drew the similarity between past and now. After touching 200-day moving average, Bitcoin price went up to touch 100-day moving average. After touching 100-day moving average, Bitcoin price broke down 200-day moving average. So, it is possible to see same scenario.
There is great bowl pattern on Bitcoin price chart at 100K USD level. If Bitcoin price breaks down 200-day moving average, this bowl pattern will support Bitcoin price. If not, it will be the end of cryto. Lots of altcoin will tocuh 0 level When Bitcoin price entered mega bearish season.

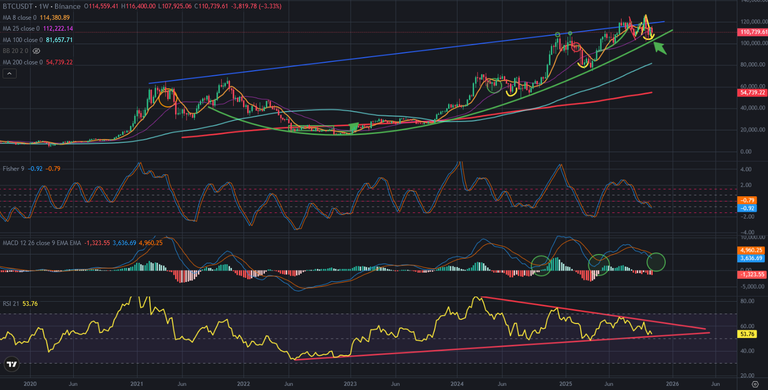
Here you can see weekly chart of Bitcoin price and the indicators. There is great support line on RSI Indicator. If the scenario happens I explained, RSI Indicator may touch support line. If it support RSI Indicator, Bitcoin price will reverse up.
So, great bowl pattern may support Bitcoin price. This is why it is name as great bowl pattern.
Mini downtrend scenario is on the table, After happening mini downtrend line, great bowl pattern may support Bitcoin price and We may pass the worst days.
We will see..
Posted Using INLEO