Bitcoin Price Reversed Down Before Touching Great Resistance
Bitcoin price went up fast after breaking up bearish flag pattern. I shared a few analysis about this bearish flag. You can see what happened on crypto market after breaking up this flag pattern.
Here you can see daily chart of Bitcoin price. There is still uptrend line coming from bearish flag pattern. After reversing down before touching great resistance, Bitcoin price may touch this support line. If it breaks down, we will see huge price drops on crypto market.
There is great resistance coming from all time high levels. Bitcoin price should break up this resistance to reach all time high level.

Here you can see the indicators on daily chart of Bitcoin price. There was downtrend line on MACD Indicators and it is broken up. You can see what happened on crypto market after breaking up this downtrend line.
Fisher Indicator is on the top and ready to reverse down. When we see more daily red candles, we will see reversing down on Fisher Indicator.
There is uptrend line on RSI indicator. RSI Indicator should not break up this support line to continue bullrun.
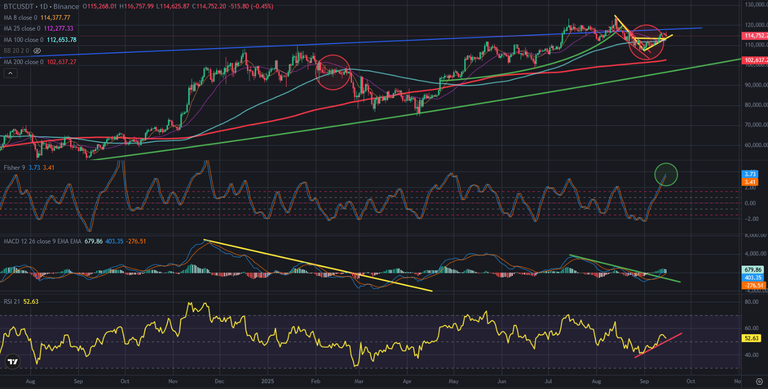
So, we are at critical week and days. If we see more red daily candles, we will see reversing down on Indicators and Bitcoin price will break down support line.
Bitcoin price is also close to break up great resistance. We will see what will happen.
Posted Using INLEO
This post has been manually curated by @bhattg from Indiaunited community. Join us on our Discord Server.
Do you know that you can earn a passive income by delegating your Leo power to @india-leo account? We share 100 % of the curation rewards with the delegators.
100% of the rewards from this comment goes to the curator for their manual curation efforts. Please encourage the curator @bhattg by upvoting this comment and support the community by voting the posts made by @indiaunited.