Bitcoin Price May Retest Head and Shoulders Pattern
Head and shoulders pattern appeared on Bitcoin price chart after breaking down mini support line with Trump & Elon fight. I shared lots of analysis about possbile head and shoulders pattern and It happened. The fight is only a reason of this pattern.
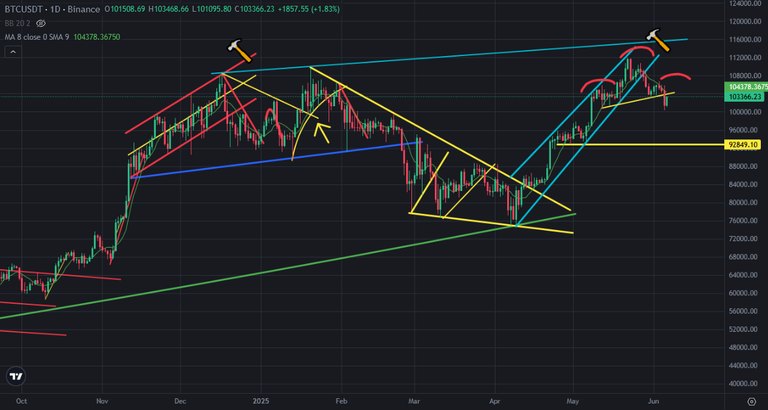
Here you can see daily chart of Bitcoin. After breaking down this mini support line, Bitcoin price is trying to reverse up. It may touch mini support line again as retest of head and shoulders pattern. After this retest we may see Bitcoin price while going to reach the target of pattern.
Here you can see the indicators on daily chart of Bitcoin. I updated the bowl pattern on RSI Indicator. Because It went down faster than I predicted. Bitcoin touched the bottom of RSI Indicators patterns bottom. It is possible to see green daily candles on Bitcoin price chart for short term. They will be for price correction during going down. The next station is the bottom of RSI Indicator.
MACD Indicator reversed down from the top. It needs also a few weeks to complete correction. Fisher Indicator is on the bottom. We may see reversing up in a few days.

So, I will wait until the target price of head and shoulders pattern. We should see Bitcoin price below 100K. When we look at RSI Indicators bowl pattern, we will see the bottom in August.
We will see..
Posted Using INLEO
Congratulations @chorock! You have completed the following achievement on the Hive blockchain And have been rewarded with New badge(s)
Your next target is to reach 91000 upvotes.
You can view your badges on your board and compare yourself to others in the Ranking
If you no longer want to receive notifications, reply to this comment with the word
STOPCheck out our last posts: