Bitcoin Price is Being Traded Between Low Range
There were miniuptrend lines on Bitcoin price chart. Bitcoin broke down the last mini uptrend line today and we have seen huge price moves nowadays. Even it broke down, Bitcoin price supported by the bottom level of flag pattern. It is tested 3 times.
Here you can see hourly chart of Bitcoin. Bitcoin price stucked between low range. It is still in flag pattern. Even it broke down, it is supported by support line and it is being traded in low range. 92800 USD is important support level for Bitcoin price chart.

Here you can see daily chart of Bitcoin and the indicators. Fisher Indicator reversed from the top. We were waiting for this reversing. MACD Indicator is close to reverse down. It needs only two days to reverse down. When MACD INdicator reverses down, we may see breaking down of 92800 USD support line.
RSI Indicator resisted by great resistance. We may see a few red candles in next days.
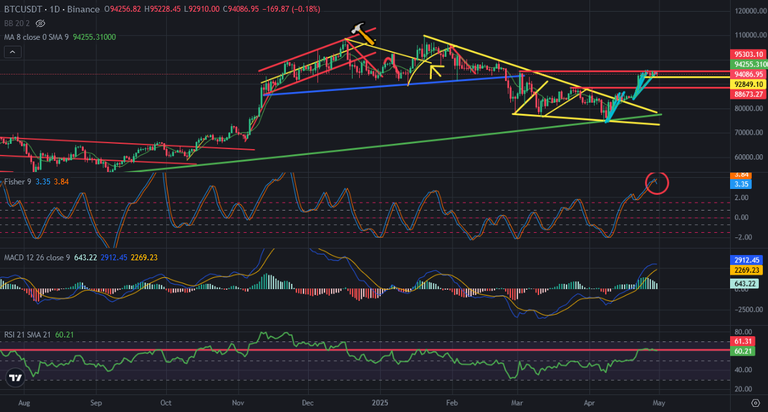
Bitcoin is trying to seem bullish while indicators reversing down. Market maker may want to make a fake move as always. Manupilation increased on crypto market on altcoins.
We will see..
Posted Using INLEO
so we will se what happend in these weeks :D
Congratulations @chorock! You have completed the following achievement on the Hive blockchain And have been rewarded with New badge(s)
You can view your badges on your board and compare yourself to others in the Ranking
If you no longer want to receive notifications, reply to this comment with the word
STOPCheck out our last posts: