Bitcoin Price Got Weak Candles in Daily Chart
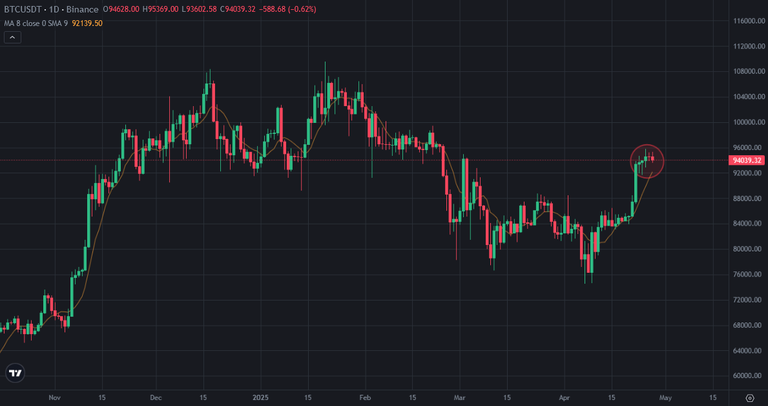
Bitcoin price went up fast with huge strong green candles. It went uo from 76K to 95K in a few days. Bitcoin is at second step of bullish move. Bitcoin price got weak candles in last 5 days. It may be for resting before 3rd bullrun or It may be the reason for reversing down.
Here you can see daily chart of Bitcoin. After getting three weak green candles, red candles staterd to appear on Bitcoin price chart. This is the second day of red candle. We have not seen two red candles in the first step of bullrun.
Here you can daily chart of Bitcoin and the indicators. I shared a few analysis about the indicators on daily chart of Bitcoin. MACD and RSI Indicator are touching the resistances. Fisher Indicator is on the top and may reverse down from this level.
If we see third red candle on daily chart of Bitcoin, we will see reversing down on Fisher Indicator. RSI and MACD Indicator will be resisted by great resistances. So, we may see reversing down on Bitcoin price chart.

95K USD is getting stronger resistance for Bitcoin price chart. We are close to enter May. Market maker likes ''Sell in May, go away''. Will it be true in this year?
We will see...
Posted Using INLEO
Thank you for your witness vote!
Have a !BEER on me!
To Opt-Out of my witness beer program just comment STOP below
View or trade
BEER.Hey @chorock, here is a little bit of
BEERfrom @isnochys for you. Enjoy it!Do you want to win SOME BEER together with your friends and draw the
BEERKING.Congratulations @chorock! You have completed the following achievement on the Hive blockchain And have been rewarded with New badge(s)
You can view your badges on your board and compare yourself to others in the Ranking
If you no longer want to receive notifications, reply to this comment with the word
STOPCheck out our last posts: