Bitcoin Price Can Not Go Up Even it Broke Up great Resistance
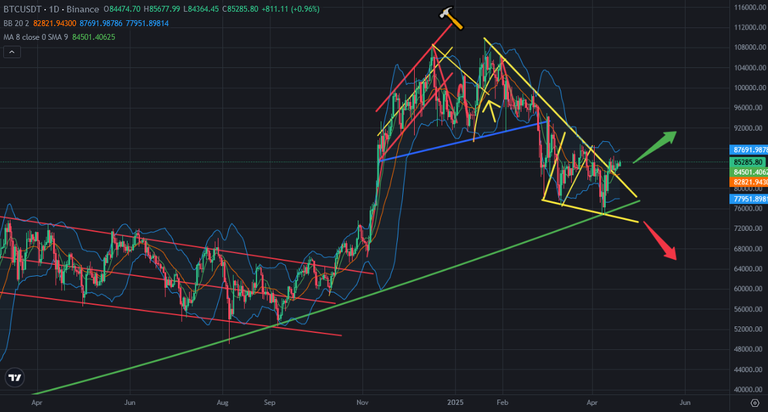
There was great resistance on Bitcoin price chart. Even Bitcoin broke up this great downtrend line, it can not go up. There may be a trouble for Bitcoin price that resists Bitcoin price.
Here you can see daily chart of Bitcoin price with Bollinger Bands. Great Resistance is broken up a few days ago at 85K USD level. Even it is broken up, Bitcoin price seems stable at 85K USD level. Bitcoin price is on the middle line of Bollinger Bands. It also support Bitcoin price for bullish move but we can not see..
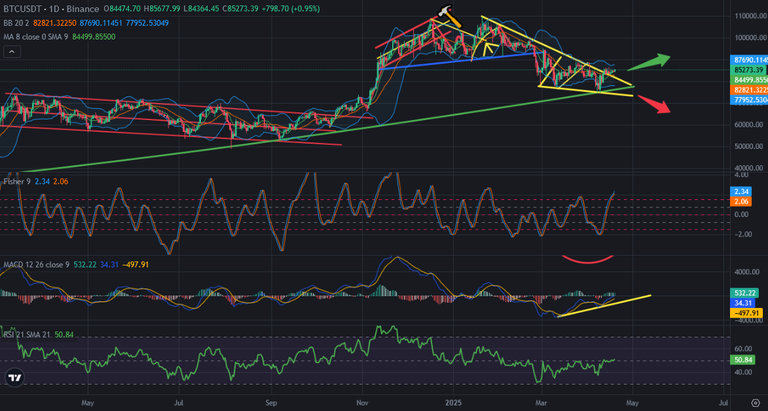
Here you can see the indicators on daily chart of Bitcoin. There is uptrend line on MACD Indicator. Even it supported Bitcoin price 2 times, Bitcoin price can not go up fast.
Fisher Indicators is on the top and may reverse down in a few days. It will reverse down until end of this month. When it reverses down, we will see breaking down on MACD Indicator. If we see this scenario, we may see price dump on Bitcoin price chart. That may be a reason for rested of downtrend line.
Market maker always makes fake moves, traps. We may see the new traps on Bitcoin price chart. I am waiting for retest on downtrend line.
We will see..
Posted Using INLEO
Thank you for your witness vote!
Have a !BEER on me!
To Opt-Out of my witness beer program just comment STOP below
Interesting insights! Do you think the current MACD and Fisher signals could lead to a temporary pullback before a stronger bullish breakout, or is it signaling a deeper trend reversal?"