Bitcoin Price Can not Break up Easily the Great Resistance
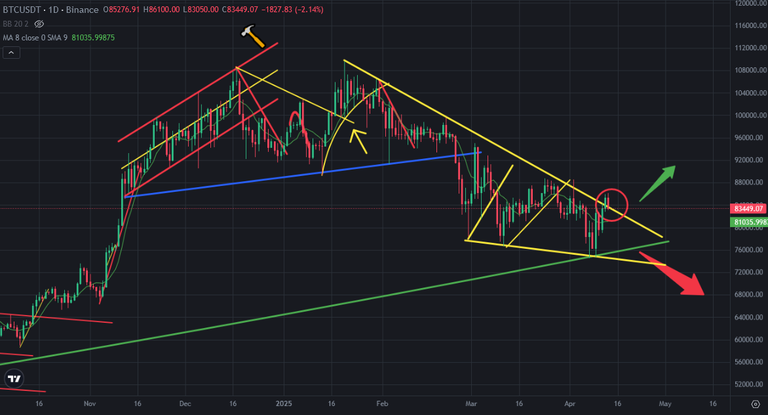
Bitcoin price is under the resistance coming from 108K. It is tested 5 times and this is 6th testing to break up this great resistance. Even it seems to be broken up, it may be a bullish trap on Bitcoin price chart.
Here you can see daily chart of Bitcoin. After mini breaking up great resistance, Bitcoin got red daily candle today. It went down below great downtrend line. We may see another try to break up this great resistance..
It is the last of week and we have not seen weekly close above this great resistance. Breaking up great resistance will not be easily. After breaking up great resistance, we should see huge price pumps on Bitcoin price chart. So, we should not see mini breaking up on this great resistance.
Here you can see the indicators on daily chart of Bitcoin. This is why I say that we should see huge green candles on Bitcoin price chart. Because All of major indicators are bullish. There was great positive divergence on RSI Indicator. MACD Indicator reversed from the bottom as Fisher Indicator. But Bitcoin has not huge green candles.
It may be a bullish trap on Bitcoin price chart. We should wait for another try..
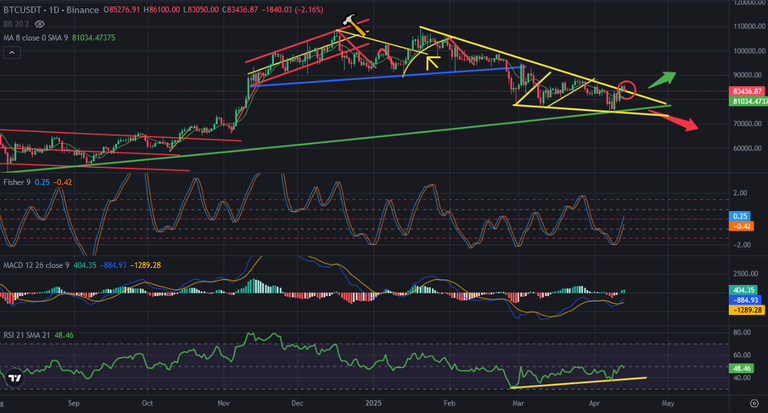
This was 6th try to break up great resistance. We will see huge daily green candle on Bitcoin price chart after breaking up great resistance. I will not be easily but It will be crazy after breaking up.
We will see..
Posted Using INLEO
Thank you for your witness vote!
Have a !BEER on me!
To Opt-Out of my witness beer program just comment STOP below
Congratulations @chorock! You have completed the following achievement on the Hive blockchain And have been rewarded with New badge(s)
You can view your badges on your board and compare yourself to others in the Ranking
If you no longer want to receive notifications, reply to this comment with the word
STOP