Bitcoin Price can not Break up 100-Day Moving Average Again
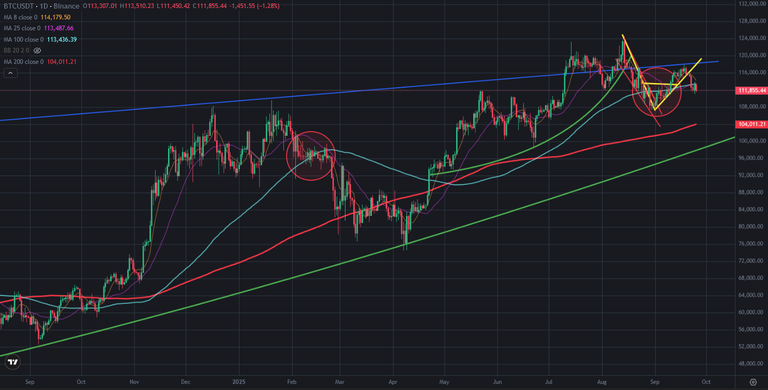
Bitcoin price is under 100-day moving average. It has broken down this moving average a few weeks ago and I could break up it again. Even it could break up it again, Bitcoin price broke down 100-day moving average again. Yesterday Bitcoin tried to go above 100-day moving average but it can not.
Here you can see daily chart of Bitcoin price. I circled the similarity between past and now. You can see what happened under 100-day moving average. Bitcoin price is under pressure of being under 100-day moving average. 200-day moving average is following Bitcoin price and It is the first great support for Bitcoin price.
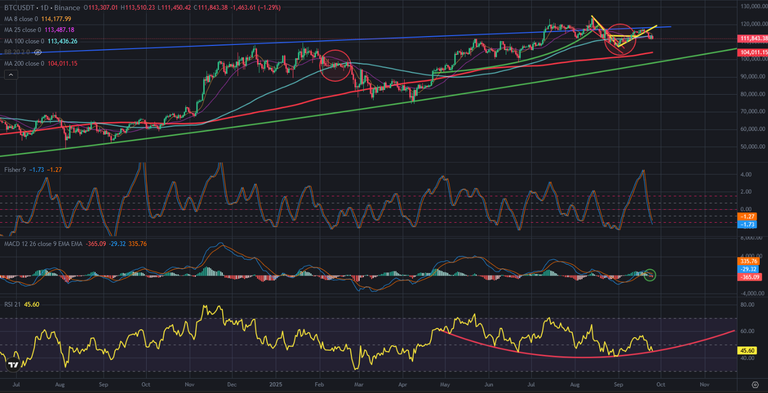
Here you can see the indicators on daily chart of Bitcoin price. There is great bowl pattern on RSI Indicator. MACD Indicator reversed down and It needs time to complete correction.
Fisher Indicator is going down and it should reverse up from the botto. It needs a few days to reverse up.
It may not be a short time price correction. So, we may not see reverse up when the indicators touch the bottom. We may see another wave of price correction.
As I said, 200-day moving average is the first great support of Bitcoin price.
We should be careful for possible market drop. Lots of altcoins are close to the bottom. If we see price correction on Bitcoin price chart again, I can not the imagine the level of altcoins.
We will see..
Posted Using INLEO
Your point about the 200-day moving average as first su;pport stands out. With MACD turned down and RSI forming that bowl, defnitely feels like we need time, kind of like waiting for water to boil :) and the 100-day MA keeps acting as ReSistance. I’m keeping risk tight on alts because if BTC drifts toward the 200-day, they’ll get hit harder, no drama needed.