Bitcoin Price Broke Up Weak Resistances One by One
There are lots of weak resistances on Bitcoin orice chart. Even Bitcoin price brokw down 100-day moving average, it reversed up and broke up these weak resistancs.
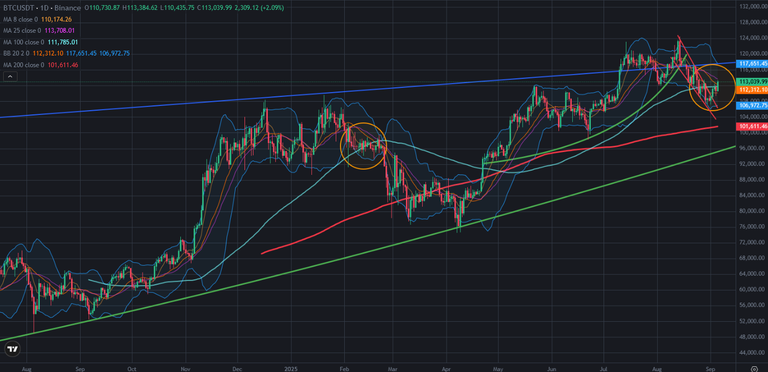
Here you can see daily chart of Bitcoin price. I shared a few anaylsis about 100-day moving average. Even Bitcoin price broke down this great resistance, It reversed up and went above this great support line. It may be bearish trap on Bitcoin price chart.
There was descending channel on Bitcoin price chart coming from all time high. Bitcoin price broke up the top level of this channel.
There was the middle line of Bollinger Bands and Bitcoin price broke up this resistance. The top line of Bollinger Bands is the next resistance on Bitcoin price chart. Bitcoin price may resist at 107K USD.
Here you can see the indicators on daily chart of Bitcoin price. There was great bowl pattern on RSI Indicator and It is broken down. There is great downtrend line on MACD Indicatorç If we see more daily green candles on Bitcoin price chart, It will be broken up. If not we will see the new downtrend on Bitcoin price chart. Fisher Indicator is on the bottom and trying to reverse up.
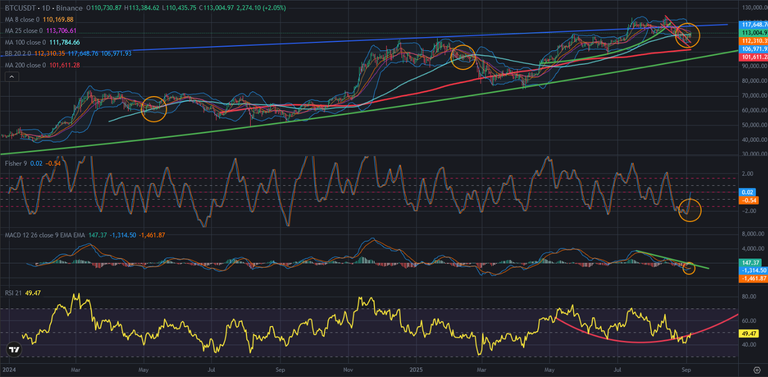
So, we may see a few green candles on daily Bitcoin price chart. When Bitcoin price touches the top level of Bollinger Bands, MACD Indicator will touch downtrend line. It may be great resistance for Bitcoin price chart.
We will see..
Posted Using INLEO