Bitcoin Price Broke up Flag Pattern
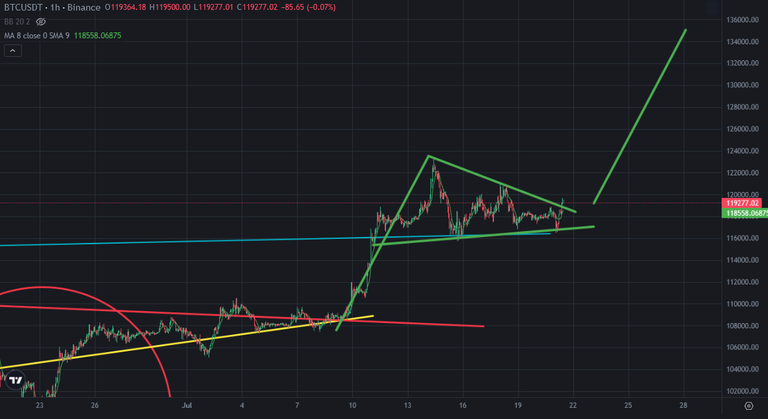
There was flag pattern on Bitcoin price chart. Bitcoin price stuck into the top line of flag pattern and great support line. After supported by this great support line, Bitcoin price broke up flag pattern which is bullish pattern. I shared an analysis about this pattern and it is completed.
Here you can see hourly chart of Bitcoin price. I shared this draft yesterday. It is broken up today. The target of this bullish flag pattern is to reach 135K USD. Bitcoin price may go up to reach this target.
Here you can see daily chart of Bitcoin and the indicators. MACD Indicator is close to resistance. It should go up for not to reverse down. Fisher Indicator is going down. When Fisher Indicator reverses up, MACD Indicator will not reverse down and It will continue to go up. It is so possible to see this scenario. MACD Indicator should break up the next great resistance.
If this scenario can not happen, we may see reversing down on MACD Indicator. It will cause price correction on Bitcoin price chart.
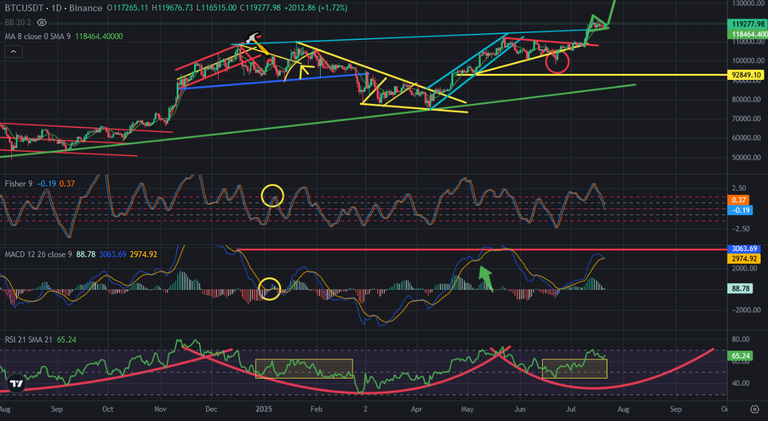
We may see huge volatility in this week. We should see huge daily candles.
We will see..
Posted Using INLEO
@tipu curate
Upvoted 👌 (Mana: 13/53) Liquid rewards.