Hive Financial Statistics – 2025.12

Welcome to the monthly financial report about the Hive blockchain.
All the information presented in this report is based on the data collected from the blockchain until 2025-12-31 midnight UTC. This report aims to provide you with a clear view of what is happening on the Hive blockchain.
1. Price
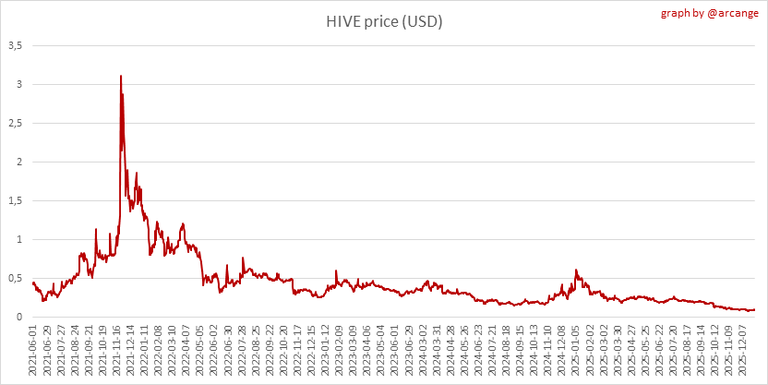 |  |
These graphs show the evolution of prices in USD for HIVE and HBD.
2. Supply

This graph shows the evolution of HIVE virtual Supply. The virtual supply is the sum of HIVE supply (liquid and staked HIVE) and HBD supply (converted into HIVE).
The graph also displays the debt ratio (HBD supply / HIVE virtual supply). Keep in mind that since hardfork 24 funds in the treasury (@hive.fund HBD balance) don't count towards the HBD debt ratio.
 |  |
These graphs show the evolution of the HIVE Supply (both liquid and staked) and the HBD supply.
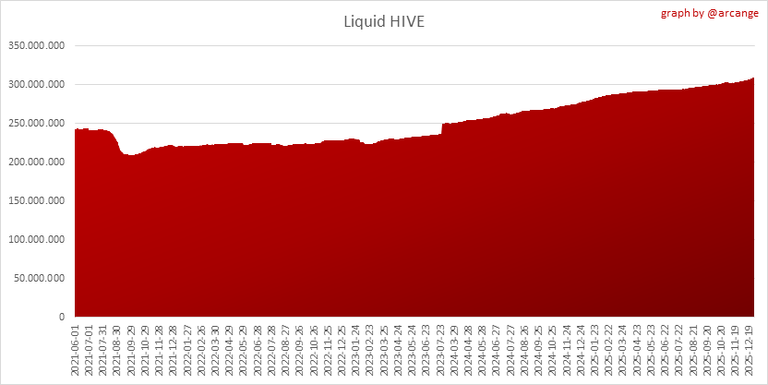 |  |
These charts show the evolution of the liquid HIVE and the staked HIVE (Hive Power).

This graph shows the overall Hive tokens distribution.
3. HBD Savings

| Account | Deposit | Account | Withdrawal |
|---|---|---|---|
| @peter.quill | 99.250 HBD | @june0620 | 5,041.678 HBD |
| @risingstargame | 62.000 HBD | @pechichemena | 1,000.000 HBD |
| @duo-curator | 50.311 HBD | @iptrucs | 796.000 HBD |
| @yann0975 | 50.000 HBD | @onezetty | 196.156 HBD |
| @glecerioberto | 40.000 HBD | @ertytuxs | 180.614 HBD |
| @risingstarhub | 31.697 HBD | @lemouth | 175.000 HBD |
| @curamax | 29.908 HBD | @felixmarranz | 130.749 HBD |
| @jesuslnrs | 28.974 HBD | @justinpencilz | 100.000 HBD |
| @lunaticanto | 23.235 HBD | @steemflow | 100.000 HBD |
| @pinkhub | 22.823 HBD | @benthomaswwd | 75.000 HBD |
This graph shows how much and how many accounts store HBD in savings. The table below shows the topmost HBD deposits and withdrawals of the day.

Note: As of 2021-06-30 (HF25) interest is only paid for HBD which are stored in savings.
This chart shows the amount of interest paid each month for holding HBD and how many accounts received such interest.
4. Balances
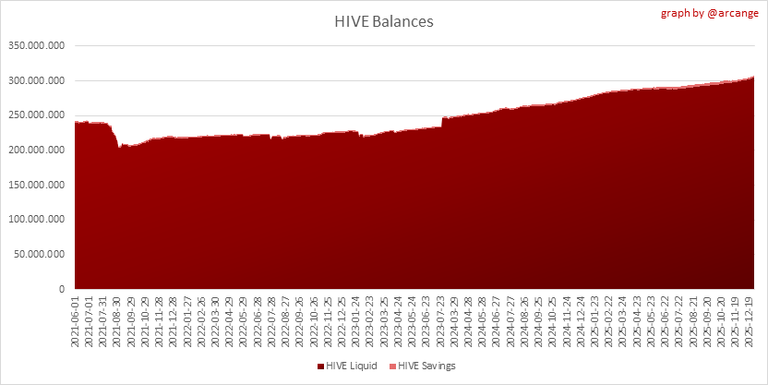
This graph shows the number of HIVE, both liquid and in savings, held by all accounts.

This graph shows the number of HBD, both liquid and in savings, held by all accounts. It also displays the amount of HBD stored in the Decentralized Hive Fund (DHF).
5. Conversions
Note: As a reminder, conversion requests are only finalized after 3 days. It is only then that it is known exactly how many HIVE were burned in return for the HBD received at the time of the conversion request.
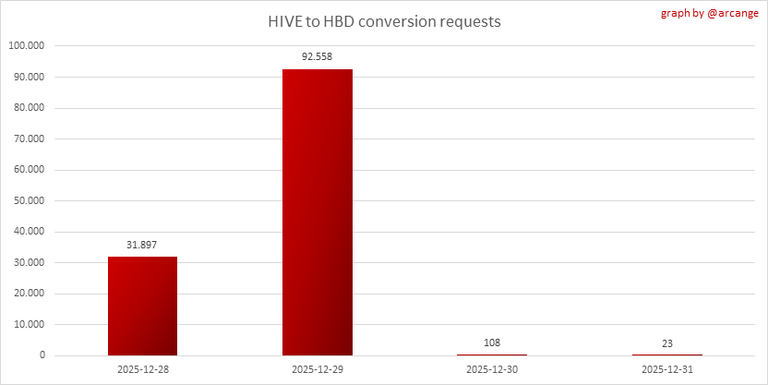
This graph shows the number of HIVE collateralized due to requests to convert HIVE to HBD over the past few days.
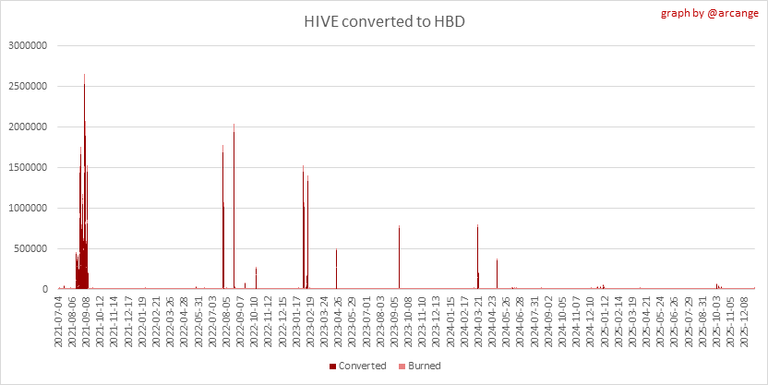 | 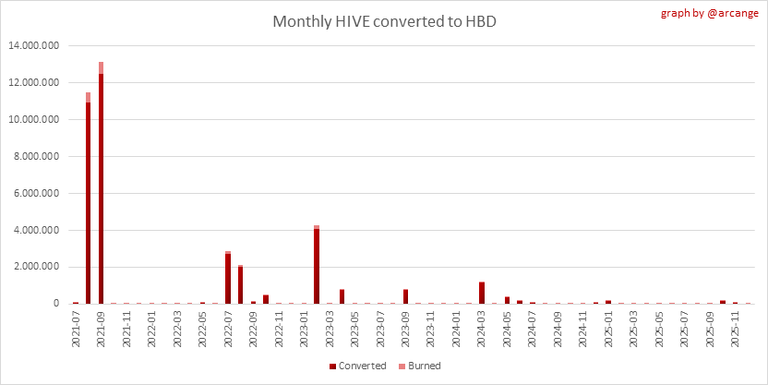 |
These graphs show the number of HIVE effectively used by the conversion process (HIVE converted and 5% HIVE fee which is burned) each day and month when requests to convert HIVE to HBD have been finalized.
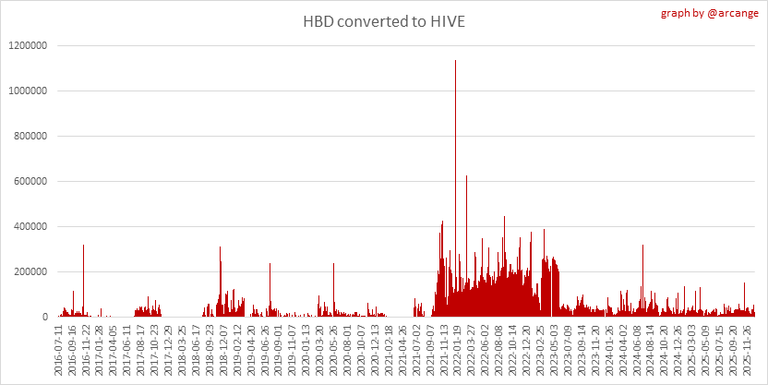 | 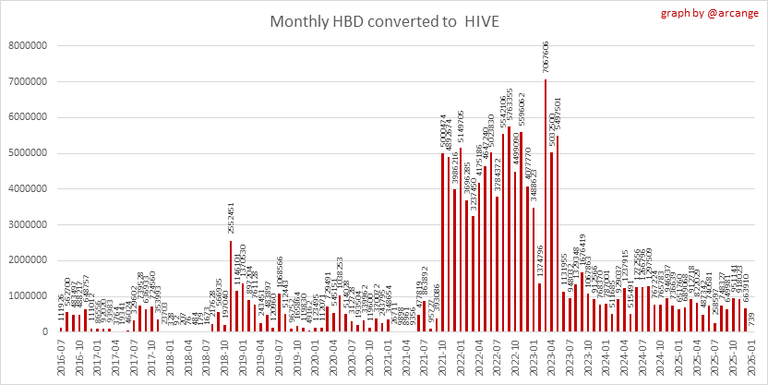 |
These graphs show the number of HBD burned, each day and each month, following requests to convert HBD to HIVE.
6. Powerup and Powerdown
| Date | Account | Amount |
|---|---|---|
| 2025-12-31 10:26:54 | @nomnomnomnom | 59,982.719 HIVE |
| 2025-12-31 01:04:27 | @ericvancewalton | 44,408.617 HIVE |
| 2025-12-31 08:49:00 | @mcsamm | 13,009.747 HIVE |
| 2025-12-31 12:32:48 | @helios.voter | 6,894.609 HIVE |
| 2025-12-31 12:41:39 | @novacadian | 2,636.707 HIVE |
| 2025-12-31 12:56:36 | @sw-kleymer | 1,015.328 HIVE |
| 2025-12-31 03:12:24 | @glecerioberto | 793.631 HIVE |
| 2025-12-31 08:26:00 | @janet.urba | 396.005 HIVE |
| 2025-12-31 07:26:18 | @asgharali | 339.427 HIVE |
| 2025-12-31 04:26:45 | @blessedglow | 273.597 HIVE |
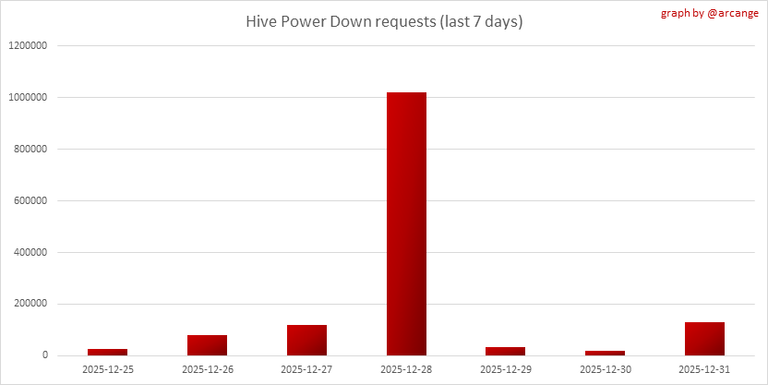
This graph and table show the amount of powerdown initiated over the last 7 days, and the largest initiated on this day.
| Account | Powerup | Account | Powerdown |
|---|---|---|---|
| @urrirru | 810.000 HIVE | @slobberchops | 23,862.952 HIVE |
| @qurator | 716.460 HIVE | @appreciator | 21,546.985 HIVE |
| @justinmora | 524.970 HIVE | @buildawhale | 7,614.639 HIVE |
| @benef.alive | 477.092 HIVE | @x30 | 7,426.420 HIVE |
| @awesomegames007 | 400.000 HIVE | @nomnomnomnom | 4,363.070 HIVE |
| @dbooster | 300.000 HIVE | @fuddu | 3,534.334 HIVE |
| @acidyo | 289.539 HIVE | @web-gnar | 2,761.821 HIVE |
| @lolitaanana001 | 180.154 HIVE | @susanli3769 | 2,310.054 HIVE |
| @dragokazo | 144.419 HIVE | @urrirru | 1,943.601 HIVE |
| @codingdefined | 135.000 HIVE | @adamferrari | 1,821.558 HIVE |
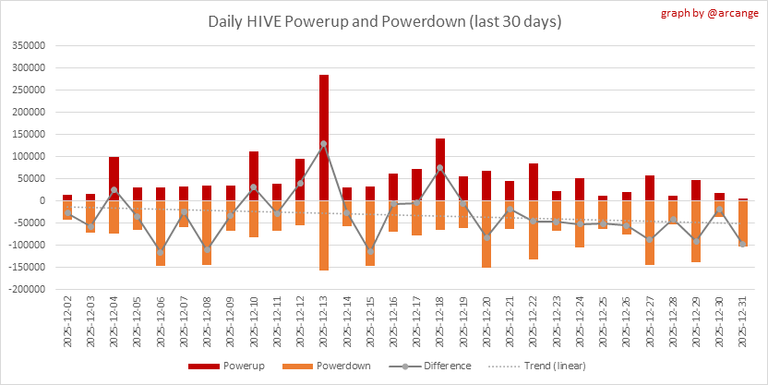
This graph shows the daily HIVE power-up, power-down, and the resulting variation over the last 30 days. The table shows the topmost power-ups and power-downs of the day.
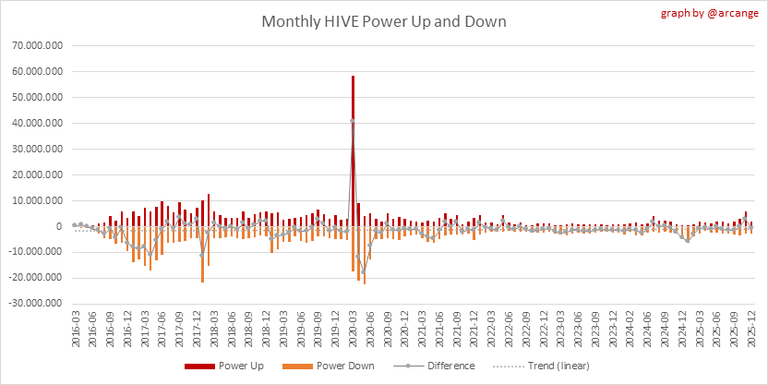
This graph shows the monthly HIVE power-up, power-down and the resulting variation.
Values for the last 3 months
| Period | Powerup | Powerdown | Difference |
|---|---|---|---|
| 2025-12 | 1,943,865.000 | 2,711,158.000 | -767,293.000 |
| 2025-11 | 5,836,335.000 | 2,800,411.000 | 3,035,924.000 |
| 2025-10 | 3,135,249.000 | 3,239,495.000 | -104,246.000 |
7. Transfers
These graphs show the volume (in USD) of HIVE and HBD transferred between accounts.
8. Exchanges
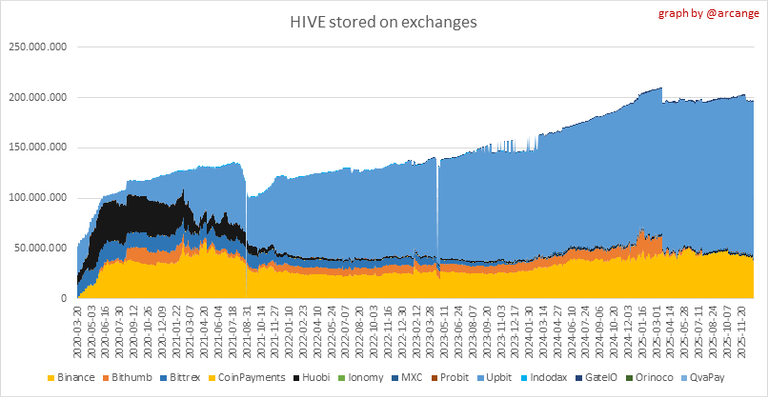
 |  |
These graphs show the amount and distribution of HIVE and HBD stored on the exchanges where they are listed.
 | 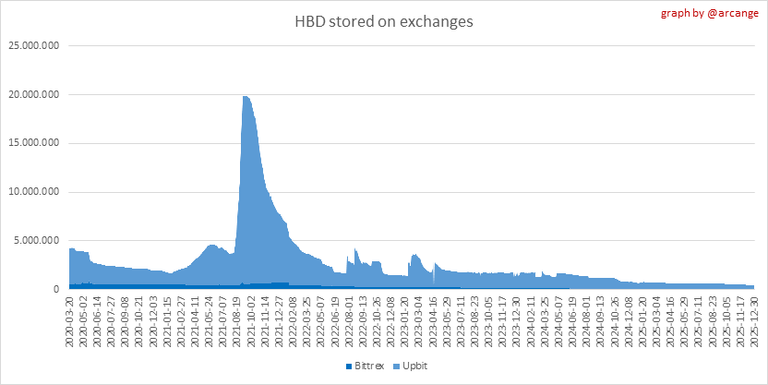 |
These graphs show the daily evolution of HIVE and HBD stored on the exchanges where they are listed.
I hope you find those stats useful. If you would like to see additional stats, feel free to drop me a comment. Your feedback is more than welcome.
Thanks for reading.
Check out my apps and services


!BEER
View or trade
BEER.Hey @arcange, here is a little bit of
BEERfrom @pixresteemer for you. Enjoy it!If you like BEER and want to support us please consider voting @louis.witness on HIVE and on HIVE Engine.
This post has been manually curated by @steemflow from Indiaunited community. Join us on our Discord Server.
Do you know that you can earn a passive income by delegating to @indiaunited. We share more than 100 % of the curation rewards with the delegators in the form of IUC tokens.
Here are some handy links for delegations: 100HP, 250HP, 500HP, 1000HP.
100% of the rewards from this comment goes to the curator for their manual curation efforts. Please encourage the curator @steemflow by upvoting this comment and support the community by voting the posts made by @indiaunited.
Great report
Thank you @oasiskp2
@arcange Hi! I saved a total of 1,000.360 HBD in multiple steps. 99.250 was the last one. Maybe you are calculating with only the last transaction?
Muy buenas estadísticas! Gran informe detallado
Muchas gracias @sw-kleymer