Hive Financial Statistics – 2025.07

Welcome to the monthly financial report about the Hive blockchain.
All the information presented in this report is based on the data collected from the blockchain until 2025-07-31 midnight UTC. This report aims to provide you with a clear view of what is happening on the Hive blockchain.
1. Price
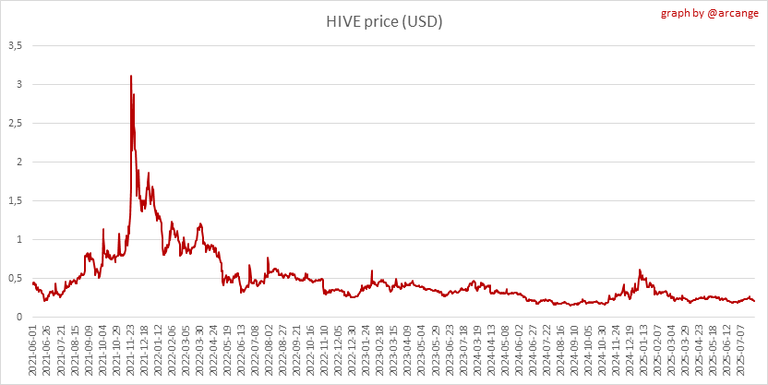 | 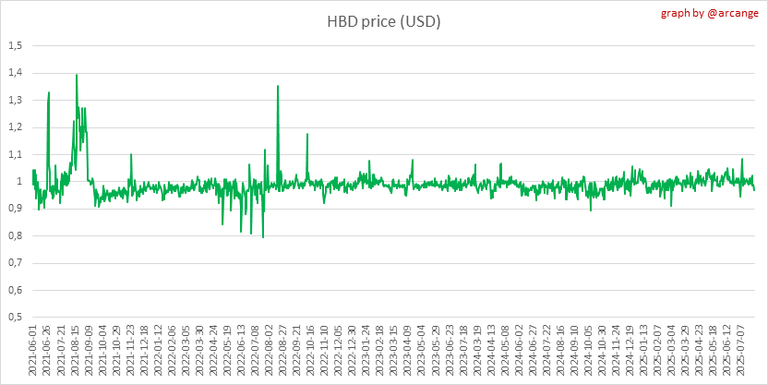 |
These graphs show the evolution of prices in USD for HIVE and HBD.
2. Supply
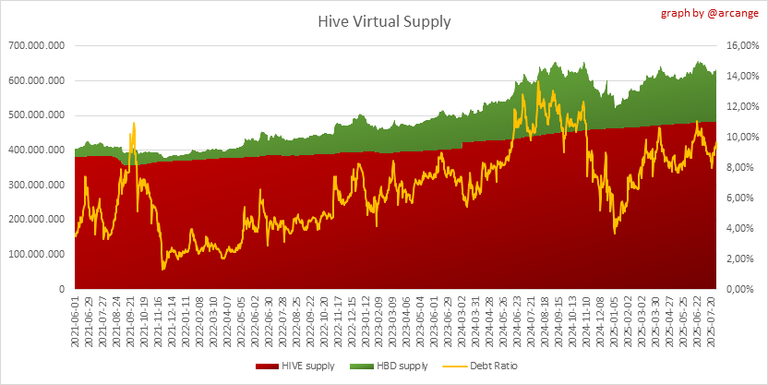
This graph shows the evolution of HIVE virtual Supply. The virtual supply is the sum of HIVE supply (liquid and staked HIVE) and HBD supply (converted into HIVE).
The graph also displays the debt ratio (HBD supply / HIVE virtual supply). Keep in mind that since hardfork 24 funds in the treasury (@hive.fund HBD balance) don't count towards the HBD debt ratio.
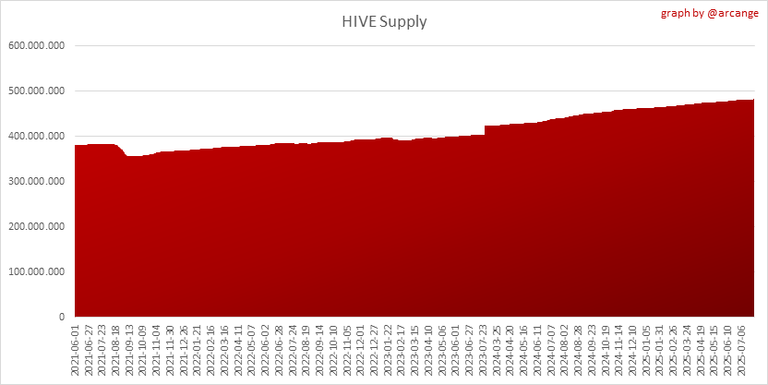 | 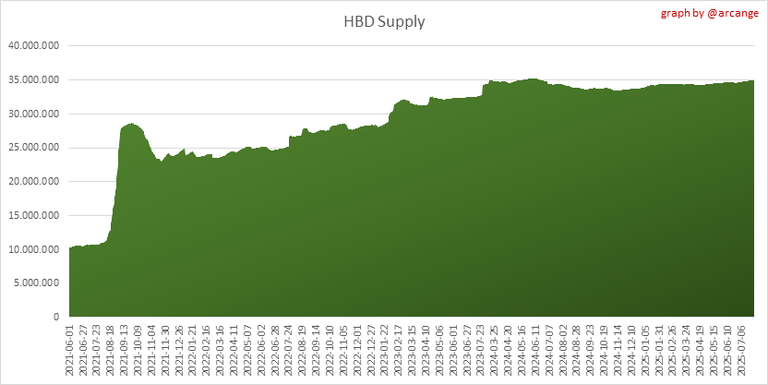 |
These graphs show the evolution of the HIVE Supply (both liquid and staked) and the HBD supply.
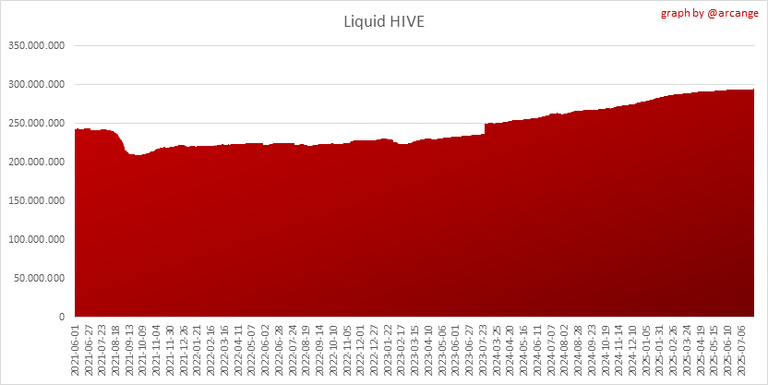 | 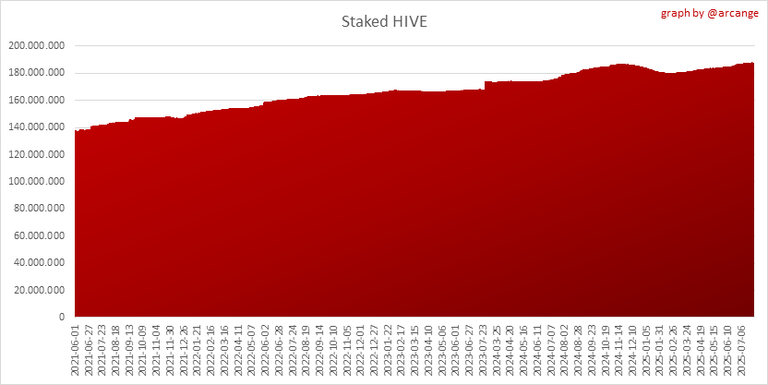 |
These charts show the evolution of the liquid HIVE and the staked HIVE (Hive Power).
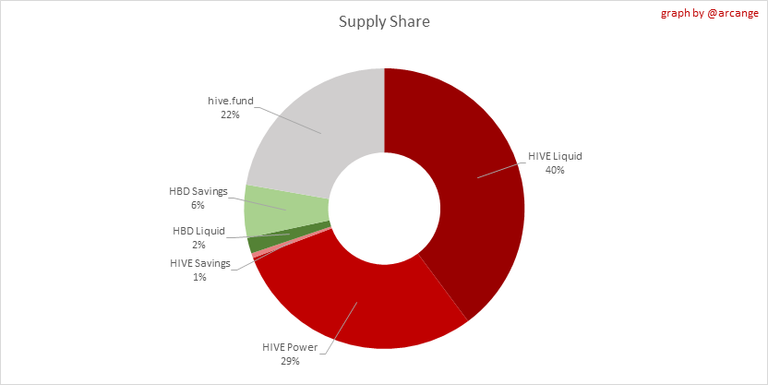
This graph shows the overall Hive tokens distribution.
3. HBD Savings
| Account | Deposit | Account | Withdrawal |
|---|---|---|---|
| @mrtats.cold | 6,119.483 HBD | @adamada.stem | 478.397 HBD |
| @letusbuyhive | 4,214.019 HBD | @revisesociology | 350.000 HBD |
| @fundacja | 2,548.630 HBD | @monochiralmonkey | 100.000 HBD |
| @v4vapp.dhf | 1,000.000 HBD | @luchyl | 100.000 HBD |
| @savingz | 205.100 HBD | @solymi | 66.484 HBD |
| @eddyss | 100.000 HBD | @ultimatewrestlin | 54.792 HBD |
| @adamferrari | 99.306 HBD | @mommyjane | 40.000 HBD |
| @bipolar95 | 76.585 HBD | @asean.hive | 40.000 HBD |
| @dotwin1981 | 56.617 HBD | @daeze-winnie | 36.000 HBD |
| @mchero | 56.243 HBD | @sagarkothari88 | 35.000 HBD |
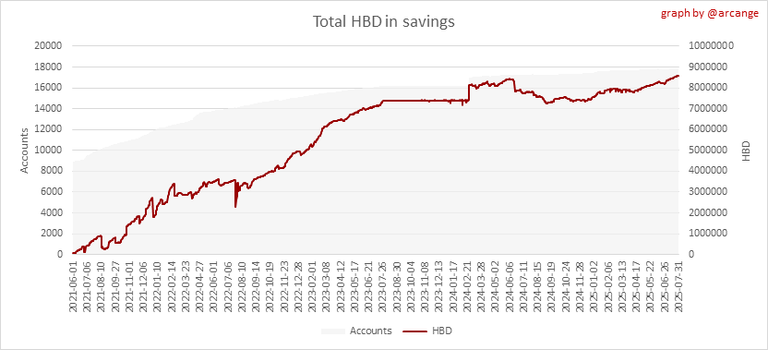
This graph shows how much and how many accounts store HBD in savings. The table below shows the topmost HBD deposits and withdrawals of the day.
Note: As of 2021-06-30 (HF25) interest is only paid for HBD which are stored in savings.
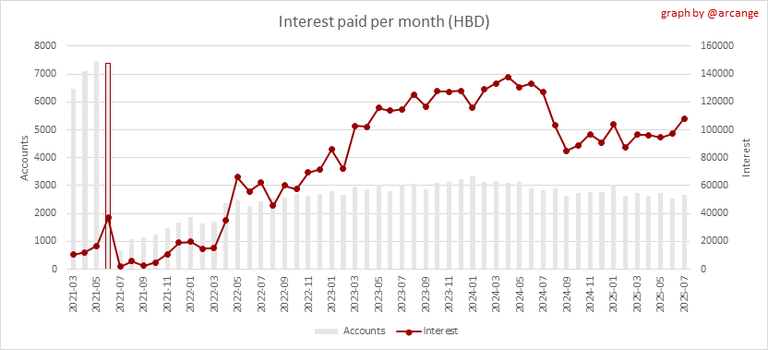
This chart shows the amount of interest paid each month for holding HBD and how many accounts received such interest.
4. Balances
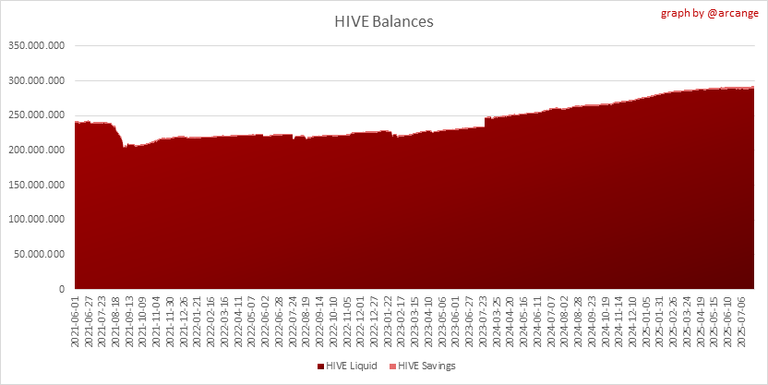
This graph shows the number of HIVE, both liquid and in savings, held by all accounts.
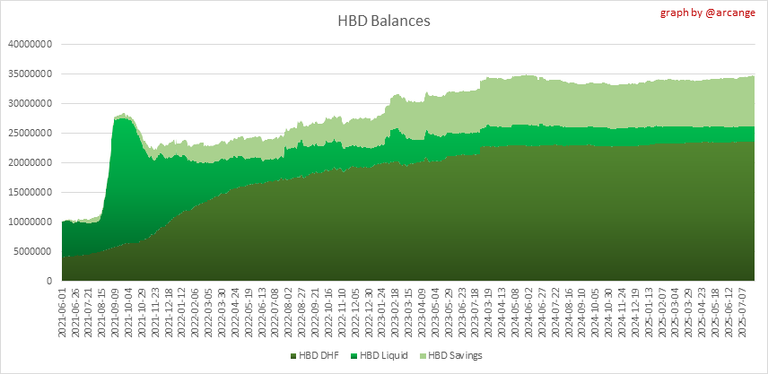
This graph shows the number of HBD, both liquid and in savings, held by all accounts. It also displays the amount of HBD stored in the Decentralized Hive Fund (DHF).
5. Conversions
Note: As a reminder, conversion requests are only finalized after 3 days. It is only then that it is known exactly how many HIVE were burned in return for the HBD received at the time of the conversion request.
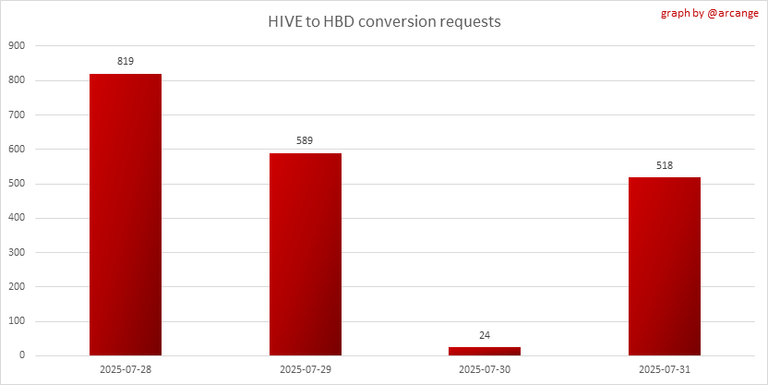
This graph shows the number of HIVE collateralized due to requests to convert HIVE to HBD over the past few days.
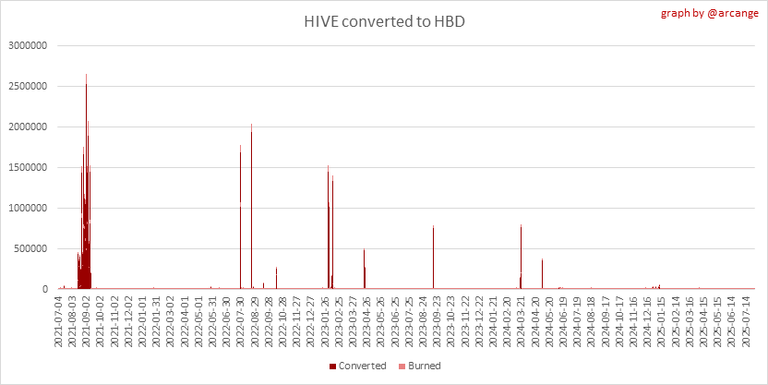 | 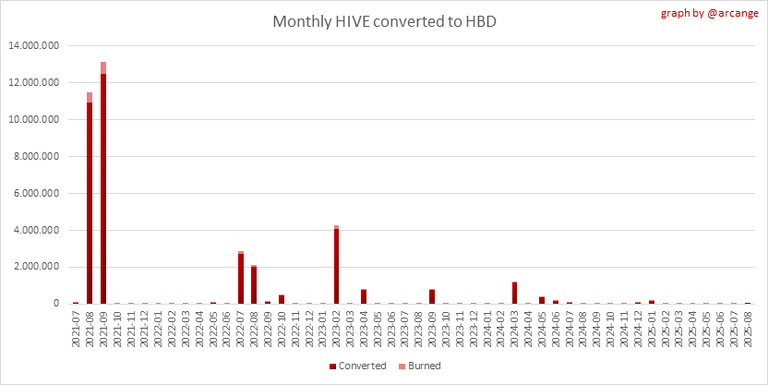 |
These graphs show the number of HIVE effectively used by the conversion process (HIVE converted and 5% HIVE fee which is burned) each day and month when requests to convert HIVE to HBD have been finalized.
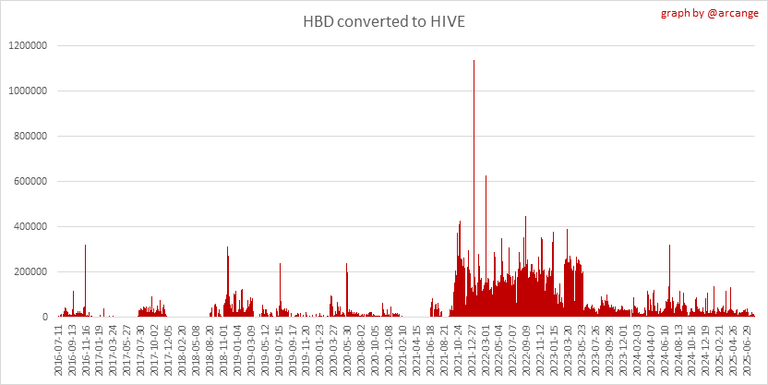 | 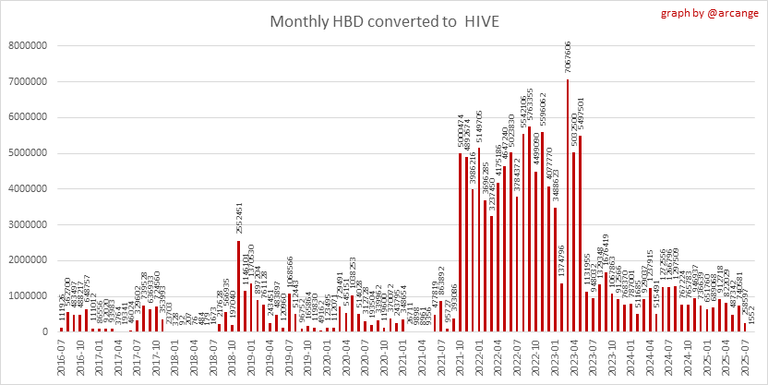 |
These graphs show the number of HBD burned, each day and each month, following requests to convert HBD to HIVE.
6. Powerup and Powerdown
| Date | Account | Amount |
|---|---|---|
| 2025-07-31 01:05:36 | @tunak | 22,309.237 HIVE |
| 2025-07-31 11:04:57 | @fjcalduch | 16,574.342 HIVE |
| 2025-07-31 04:57:03 | @stafhalr | 14,741.039 HIVE |
| 2025-07-31 10:15:00 | @pavelsku | 12,837.940 HIVE |
| 2025-07-31 11:05:09 | @drakos | 8,000.086 HIVE |
| 2025-07-31 03:14:39 | @cur8 | 3,853.395 HIVE |
| 2025-07-31 02:01:42 | @paolobeneforti | 3,048.808 HIVE |
| 2025-07-31 03:31:42 | @innerhive | 2,751.489 HIVE |
| 2025-07-31 09:29:09 | @macchiata | 2,588.147 HIVE |
| 2025-07-31 10:31:06 | @yolimarag | 2,236.791 HIVE |
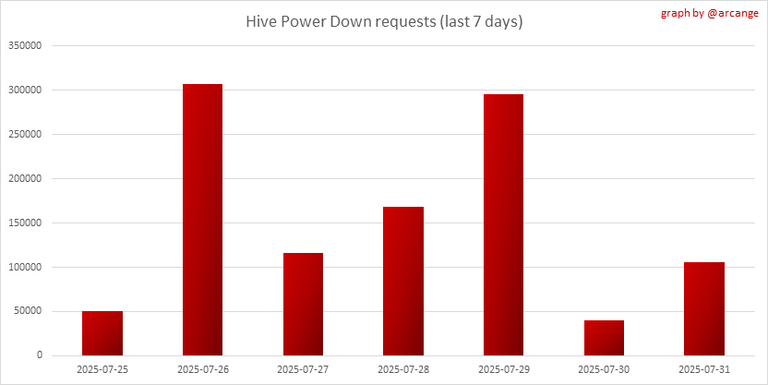
This graph and table show the amount of powerdown initiated over the last 7 days, and the largest initiated on this day.
| Account | Powerup | Account | Powerdown |
|---|---|---|---|
| @mcgi.cares | 97,481.321 HIVE | @pishio | 8,856.052 HIVE |
| @essejparr | 2,165.152 HIVE | @vortac | 7,745.304 HIVE |
| @jlphotographyart | 1,694.821 HIVE | @erikah | 7,116.182 HIVE |
| @grendel25 | 1,500.000 HIVE | @zingtoken | 3,003.109 HIVE |
| @wayfar | 1,190.059 HIVE | @dsc-r2cornell | 2,935.127 HIVE |
| @mrchef111 | 432.216 HIVE | @reward.app | 2,004.541 HIVE |
| @gargi | 193.574 HIVE | @tipu | 1,870.280 HIVE |
| @bengy | 101.188 HIVE | @gniksivart | 1,549.943 HIVE |
| @awesomegames007 | 89.000 HIVE | @web-gnar | 1,516.102 HIVE |
| @hiveecuador | 77.891 HIVE | @cryptothesis | 1,192.717 HIVE |
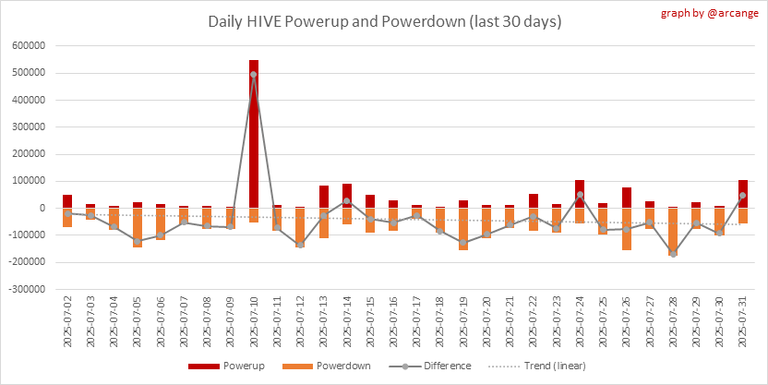
This graph shows the daily HIVE power-up, power-down, and the resulting variation over the last 30 days. The table shows the topmost power-ups and power-downs of the day.
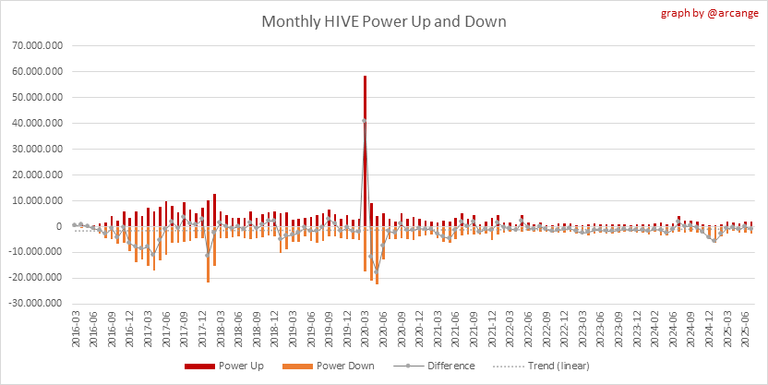
This graph shows the monthly HIVE power-up, power-down and the resulting variation.
Values for the last 3 months
| Period | Powerup | Powerdown | Difference |
|---|---|---|---|
| 2025-07 | 1,813,135.000 | 2,786,456.000 | -973,321.000 |
| 2025-06 | 2,130,435.000 | 2,303,179.000 | -172,744.000 |
| 2025-05 | 1,246,581.000 | 2,457,065.000 | -1,210,484.000 |
7. Transfers
These graphs show the volume (in USD) of HIVE and HBD transferred between accounts.
8. Exchanges
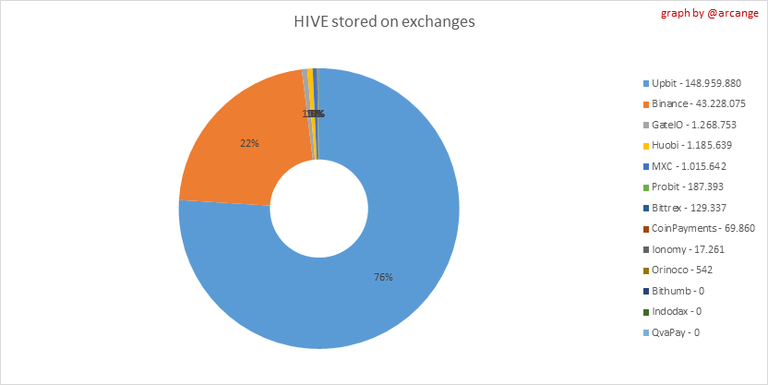 | 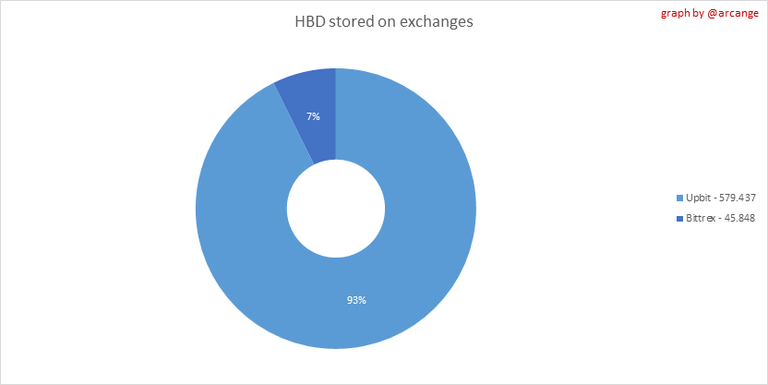 |
These graphs show the amount and distribution of HIVE and HBD stored on the exchanges where they are listed.
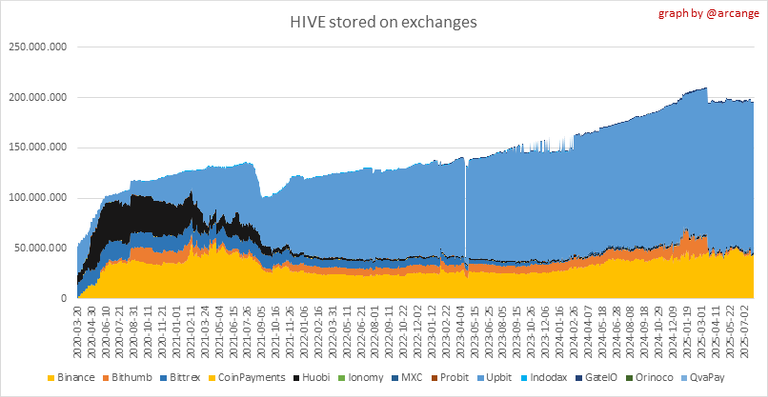 | 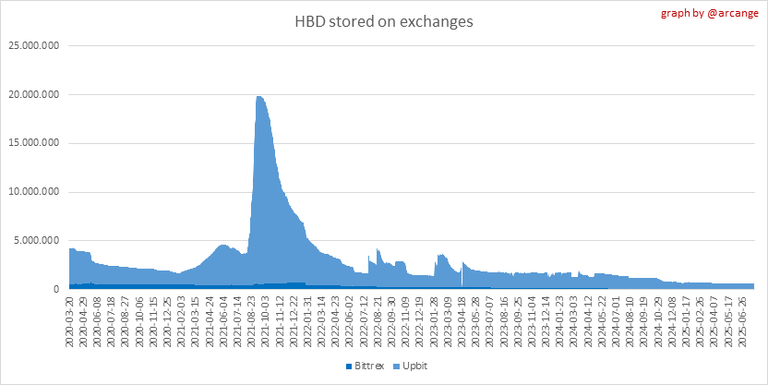 |
These graphs show the daily evolution of HIVE and HBD stored on the exchanges where they are listed.
I hope you find those stats useful. If you would like to see additional stats, feel free to drop me a comment. Your feedback is more than welcome.
Thanks for reading.
Check out my apps and services


!BEER
View or trade
BEER.Hey @arcange, here is a little bit of
BEERfrom @pixresteemer for you. Enjoy it!Did you know that <a href='https://dcity.io/cityyou can use BEER at dCity game to buy cards to rule the world.
View or trade
BEER.Hey @arcange, here is a little bit of
BEERfrom @pixresteemer for you. Enjoy it!We love your support by voting @detlev.witness on HIVE .
The main issue remains that just more people power down and dump even at current price levels compared to ones who buy and power up. Everyone who's upvoting putting more importance onto KE Ratio would be a good start to possily solve it. The many pure value extractors should not be able to do it this easily.
I appreciate the stats, @arcange, but what scares me is the metric on new users.
First, thanks for compiling July’s finance report. Transparency matters. But while price and supply curves look steady, Hive’s real problem is momentum—and we’re flat-lining while up-and-comers like Zora rocket ahead.
Zero buzz beyond Hive
Scroll YouTube or Crypto-Twitter, and Hive barely registers—not even hate-clicks. A social platform without outside conversation is a museum after hours.
UI still feels Web 2.0
The interface hasn’t meaningfully evolved in years. Newcomers expect slick, wallet-aware, mobile-first UX; instead, they find dated menus and confusing key management.
On- / off-ramping capital is painful.
No Coinbase listing, limited fiat gateways, and clunky onboarding remain massive friction points.
Marketing vacuum
There’s no coordinated ad push, influencer outreach, or educational funnel. If nobody hears about Hive, nobody tries Hive.
Echo-chamber up-vote economy
Quality newcomers get ignored while the same tight circles recycle rewards. That kills motivation faster than any bear market.
Meanwhile, Zora is eating our lunch
Zora just logged 2 million+ monthly active users and 77 k new sign-ups in a single week
Binance.
Over 100 000 tokens minted in 48 hours and $63 M in daily volume last month
Bingx Exchange.
Hive’s biggest frontend, PeakD, managed barely 3 900 MAUs in July; Ecency came in at ~3 200
PeakD.
That gap isn’t a blip—it’s a chasm that widens every month we stand still.
I’ve stuck around seven years because I want Hive to win, but nostalgia won’t keep the lights on. Until we attack user growth, UX, and outreach with the same rigor you apply to token stats, the charts will keep looking healthy while the community quietly withers.
Happy to help brainstorm solutions if anyone’s listening—otherwise I’ll be exploring other corners of Web 3.
Thank you so much for this! I always look for your updates because they provide an invaluable look at our blockchain. I have been speculating lately what might support the price of Hive. I wonder if saving an extra 50M or 100M HBD would help support HIVE price. Do you think HBD savings is sustainable at those levels? What do you suspect that 100M HBD, or 500M HBD would do? I look forward to the next time HIVE rises past $1, and wonder often if it can break above $3 again or if it will only trade between 0.20 and 0.80?